Daniocell
fbxl4 (taste / olfactory)
F-box and leucine-rich repeat protein 4
ZFIN
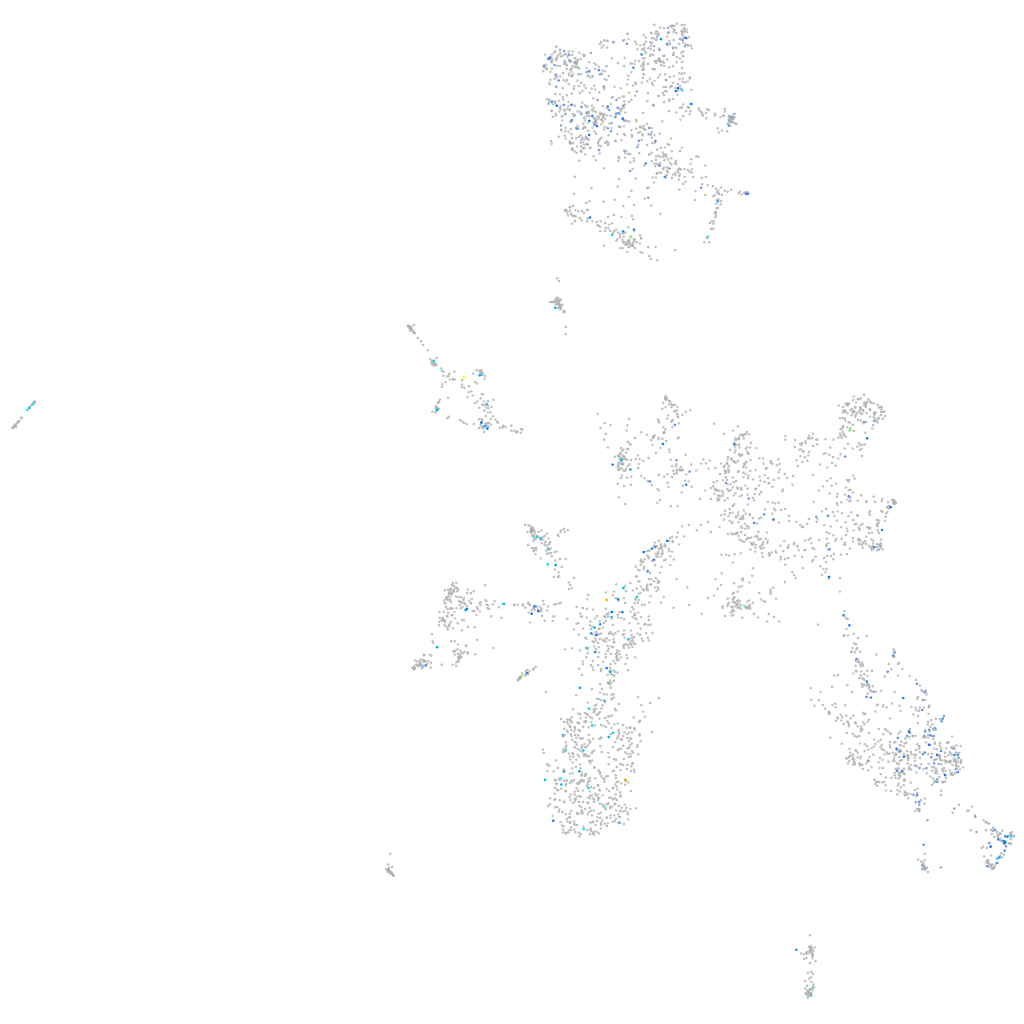
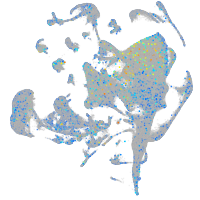
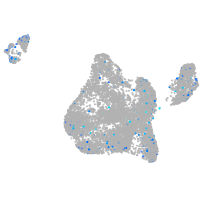
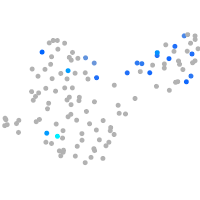
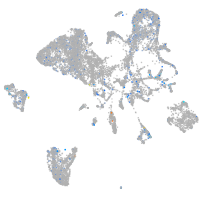
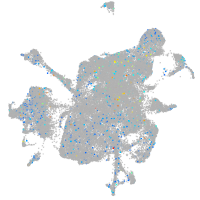
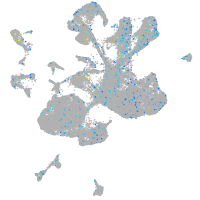
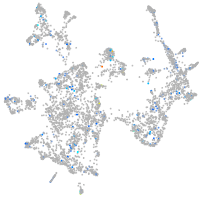
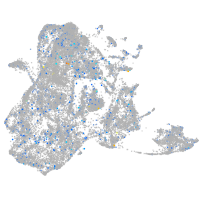
Gene expression UMAP
Display:
Expression
Stage
Other cell groups
all cells
blastomeres
PGCs
endoderm
axial mesoderm
muscle
mural cells /
non-skeletal muscle
mesenchyme
hematopoietic /
vasculature
pronephros
neural
spinal cord / glia
eye
taste / olfactory
otic / lateral line
epidermis
periderm
fin
ionocytes / mucous
pigment cells
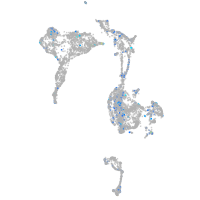
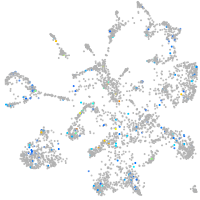
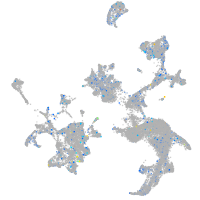
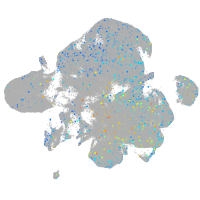
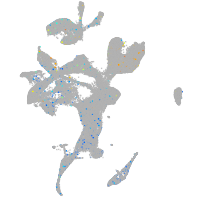
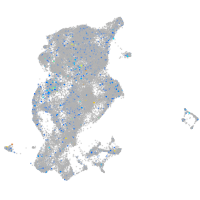
Expression by stage/cluster
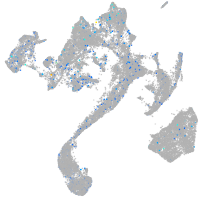
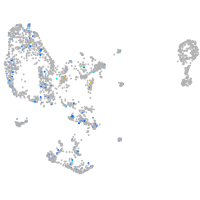
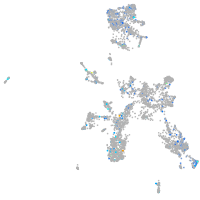
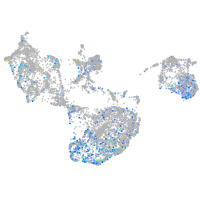
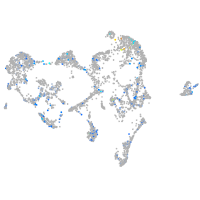
Correlated gene expression
Positive correlation
Negative correlation
Gene
r
Gene
r
kcnv2a
0.190
stmn1a
-0.068
gldn
0.137
dut
-0.064
si:ch211-197h24.8
0.134
rpa2
-0.062
LOC101885134
0.131
nasp
-0.058
LOC101886478
0.131
pcna
-0.056
BX005275.2
0.127
mibp
-0.056
LOC101884641
0.125
her15.1
-0.055
tlr5a
0.122
chaf1a
-0.055
LOC101885924
0.122
cdca7b
-0.054
BX324142.1
0.117
mki67
-0.053
BX323855.1
0.116
ccna2
-0.053
XLOC-041558
0.114
nutf2
-0.052
BX323067.1
0.114
dek
-0.052
grm2a
0.114
her2
-0.051
CR788235.1
0.114
CABZ01005379.1
-0.051
igfbp6a
0.113
her4.1
-0.051
si:ch211-226m7.4
0.113
snrpc
-0.050
LOC101884649
0.112
mcm7
-0.050
CR925817.1
0.111
her4.2
-0.050
ftr98
0.111
slbp
-0.050
ccdc17
0.110
rps10
-0.050
si:ch211-225k7.5
0.110
rpa3
-0.050
grm2b
0.110
si:dkey-151g10.6
-0.050
LOC108190082
0.109
cx43.4
-0.050
si:ch211-105n15.1
0.109
si:dkey-6i22.5
-0.050
si:dkey-183p4.10
0.109
zgc:110540
-0.049
FP085399.2
0.109
naa40
-0.049
LOC100332108
0.109
rrm2
-0.049
LOC110437802
0.109
rpl23a
-0.049
CR626902.1
0.109
dla
-0.049
znf1165
0.109
etf1b
-0.049
spi2
0.108
fbxo5
-0.048
vgll2b
0.107
chtf8
-0.048
CT573231.1
0.106
nutf2l
-0.048
bpifcl
0.106
si:dkey-261m9.17
-0.048