Daniocell
fars2 (blastomeres)
"phenylalanyl-tRNA synthetase 2, mitochondrial"
ZFIN
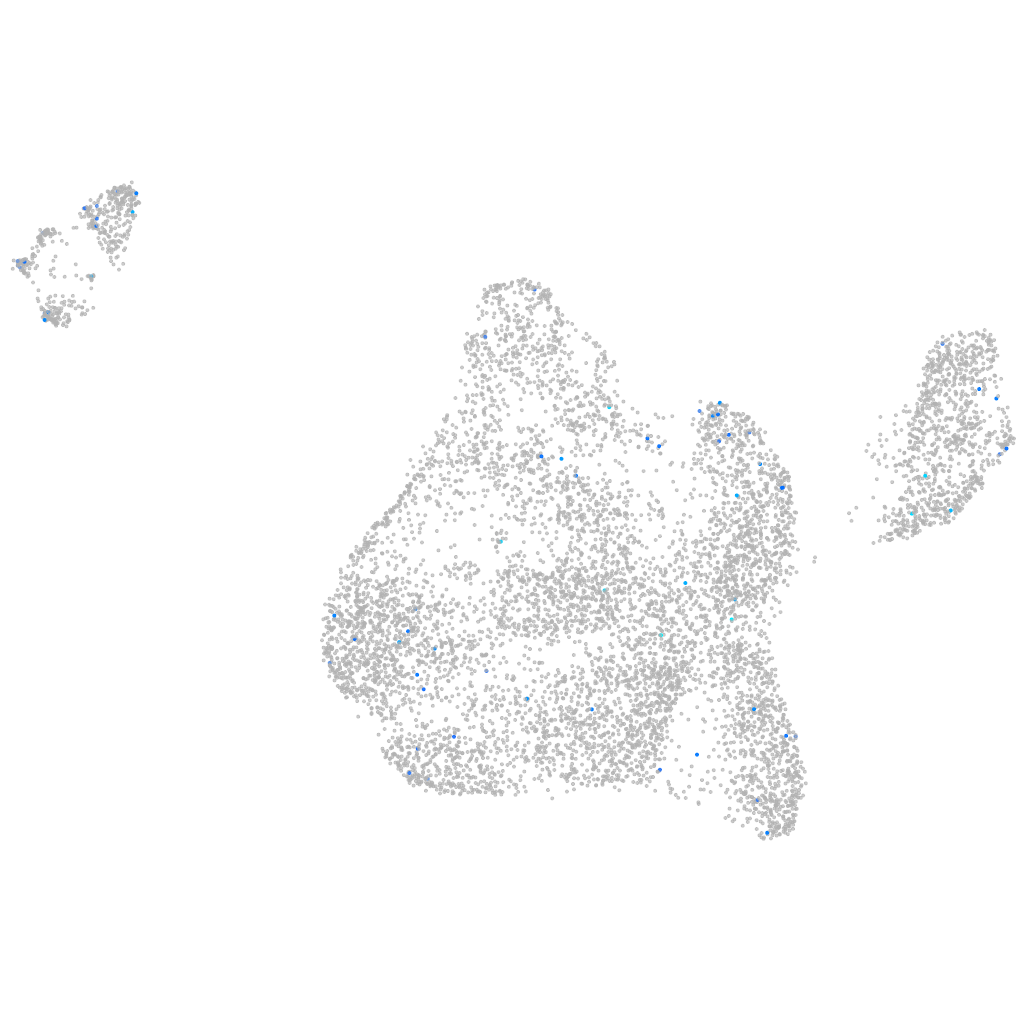
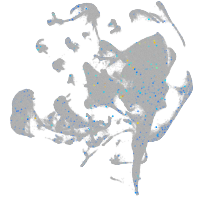
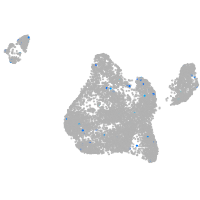
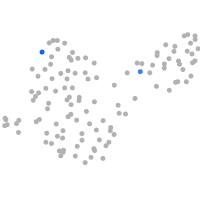
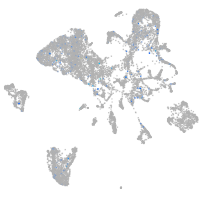
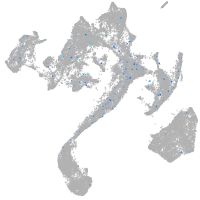
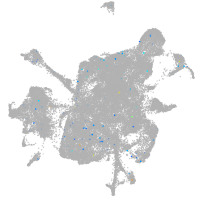
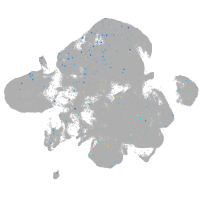
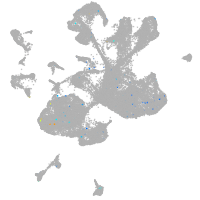
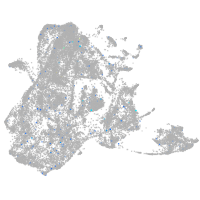
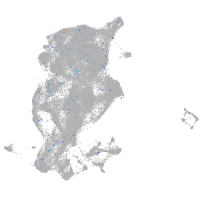
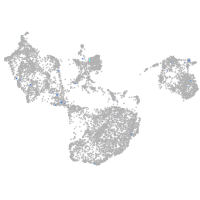
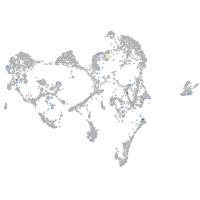
Gene expression UMAP
Display:
Expression
Stage
Other cell groups
all cells
blastomeres
PGCs
endoderm
axial mesoderm
muscle
mural cells /
non-skeletal muscle
mesenchyme
hematopoietic /
vasculature
pronephros
neural
spinal cord / glia
eye
taste / olfactory
otic / lateral line
epidermis
periderm
fin
ionocytes / mucous
pigment cells
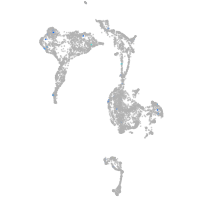
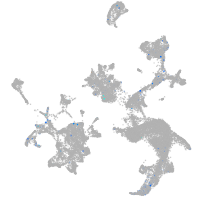
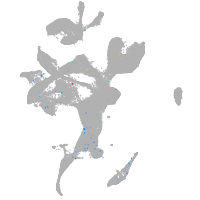
Expression by stage/cluster
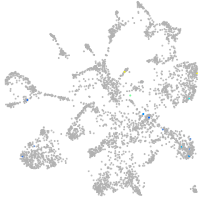
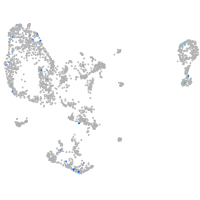
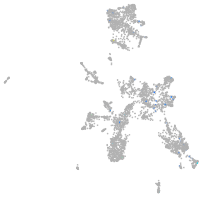
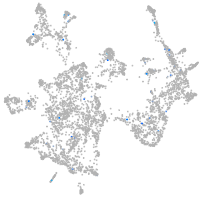
Correlated gene expression
Positive correlation
Negative correlation
Gene
r
Gene
r
BX511187.1
0.200
rpl26
-0.050
BX324146.1
0.196
si:ch211-222l21.1
-0.044
LOC101885178
0.188
hmga1a
-0.042
myb
0.178
rpl36
-0.041
CABZ01046996.1
0.168
si:ch211-152c2.3
-0.041
LOC100007229
0.159
rps27a
-0.039
CR788316.1
0.145
dynll1
-0.038
LOC108179136
0.141
marcksl1b
-0.038
kiss2
0.135
hnrnpa0b
-0.037
ahrra
0.127
rpl23
-0.037
si:ch211-276a23.5
0.123
h2afvb
-0.036
foxg1c
0.123
atp5f1e
-0.036
si:dkey-108k21.7
0.123
rps27.1
-0.035
cuzd1.2
0.123
rps15
-0.035
gpr31
0.120
hspb1
-0.034
mgat3b
0.116
apoc1
-0.033
XLOC-033023
0.115
si:ch73-1a9.3
-0.033
XLOC-011850
0.108
rps4x
-0.032
si:dkey-203a12.2
0.108
naca
-0.031
gltpd2
0.107
rpl21
-0.031
CR627496.1
0.106
faua
-0.031
BX004981.2
0.104
rpl24
-0.030
CT990567.2
0.103
snrpd2
-0.030
LOC101882525
0.102
rpl35
-0.030
CR848841.1
0.101
hsp90ab1
-0.030
wif1
0.100
eef1b2
-0.029
VSTM2A
0.100
rpl29
-0.029
mrap2b
0.099
snrpe
-0.029
gdap1l1
0.099
exosc5
-0.029
slc52a3
0.095
khdrbs1a
-0.029
si:dkey-21h14.9
0.094
rplp1
-0.028
LO018608.1
0.091
hnrnpa1b
-0.028
LOC108180734
0.090
rps23
-0.027
plaua
0.088
rps21
-0.027
ptgs1
0.088
gadd45ga
-0.027