Daniocell
far1 (epidermis)
fatty acyl CoA reductase 1
ZFIN
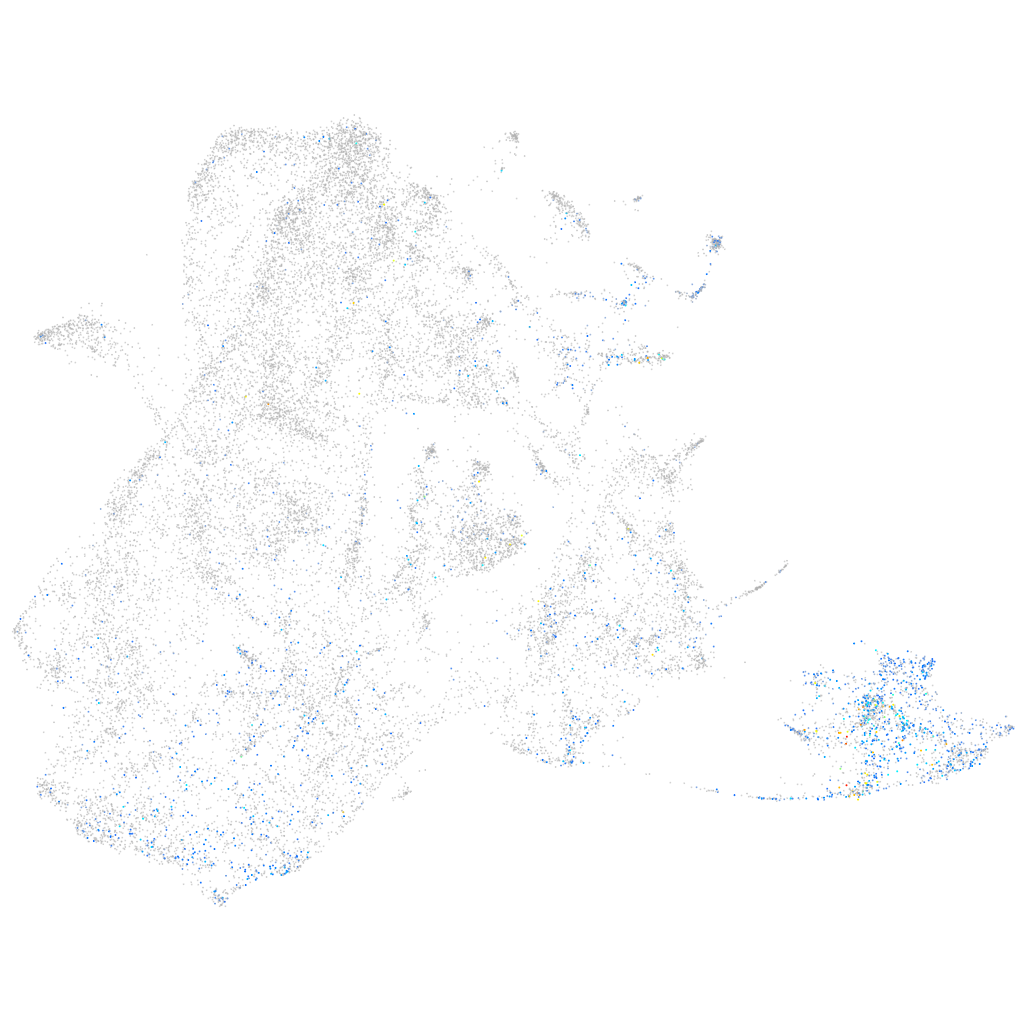
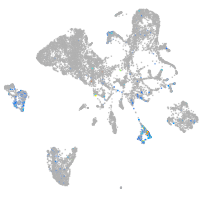
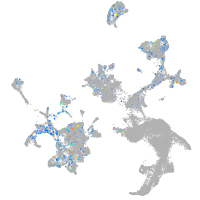
Gene expression UMAP
Display:
Expression
Stage
Other cell groups
all cells
blastomeres
PGCs
endoderm
axial mesoderm
muscle
mural cells /
non-skeletal muscle
mesenchyme
hematopoietic /
vasculature
pronephros
neural
spinal cord / glia
eye
taste / olfactory
otic / lateral line
epidermis
periderm
fin
ionocytes / mucous
pigment cells
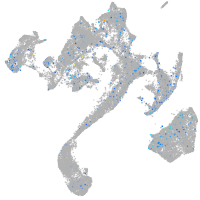
Expression by stage/cluster
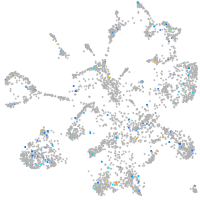
Correlated gene expression
Positive correlation
Negative correlation
Gene
r
Gene
r
evplb
0.346
tmsb4x
-0.222
ponzr5
0.339
sparc
-0.211
lye
0.337
col1a2
-0.198
evpla
0.337
cldn1
-0.196
si:cabz01007794.1
0.332
col11a1a
-0.178
si:ch211-157c3.4
0.330
postnb
-0.176
si:ch211-125o16.4
0.328
pfn1
-0.176
cldne
0.328
cotl1
-0.176
krt1-19d
0.327
col1a1b
-0.175
stard14
0.323
col1a1a
-0.173
scel
0.323
si:dkey-16p21.8
-0.173
si:ch73-204p21.2
0.322
ecrg4b
-0.171
zgc:153665
0.321
col2a1b
-0.170
ppl
0.316
cldni
-0.166
zgc:100868
0.314
krt5
-0.164
dhrs13a.2
0.310
rbp4
-0.150
elovl7b
0.309
spaca4l
-0.149
CABZ01039859.1
0.305
actb2
-0.147
hsd17b12a
0.304
zgc:86896
-0.145
cldn23a
0.300
ptmaa
-0.144
agr1
0.297
krt91
-0.143
anxa1c
0.297
aqp3a
-0.138
si:ch73-347e22.8
0.295
zgc:101810
-0.136
stx11b.1
0.291
lgals1l1
-0.135
anxa1b
0.290
krtt1c19e
-0.134
si:dkey-87o1.2
0.290
aep1
-0.133
si:ch211-195b11.3
0.288
dcn
-0.133
gbgt1l4
0.286
zgc:136930
-0.131
tmem45b
0.284
itgb4
-0.131
capn9
0.282
itgb1b.1
-0.127
si:dkey-222n6.2
0.282
kera
-0.126
plekhf1
0.281
cyt1l
-0.125
krt92
0.280
vdac3
-0.125
icn2
0.280
flna
-0.124
ANXA1 (1 of many)
0.279
col14a1b
-0.124