
FAM3 metabolism regulating signaling molecule A
ZFIN 
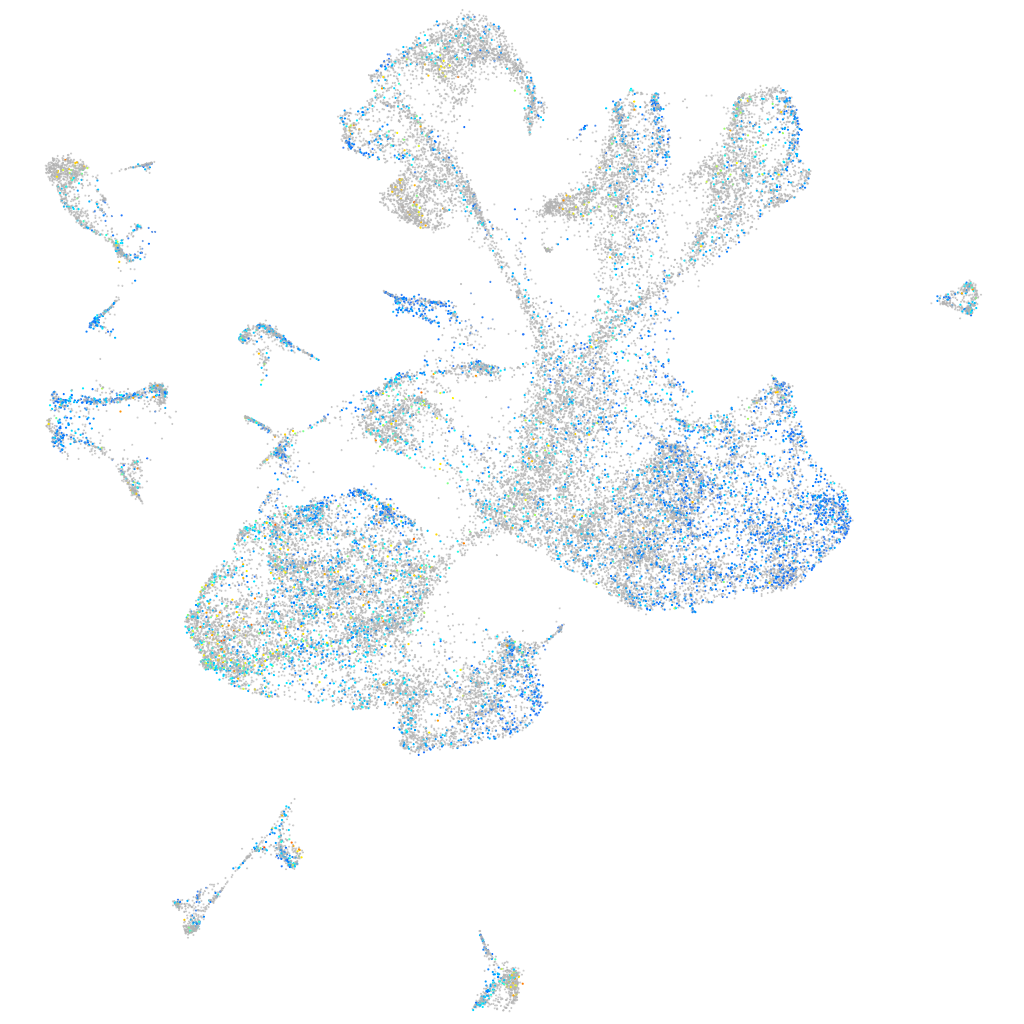
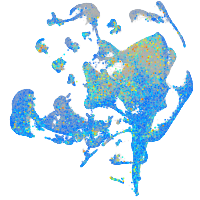
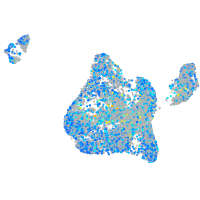
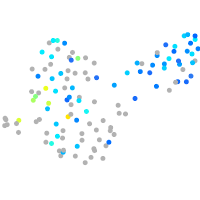
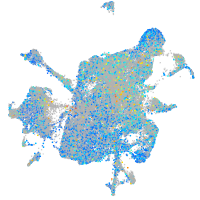
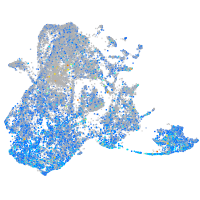
Gene expression UMAP


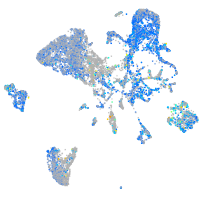
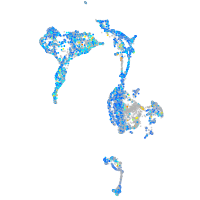
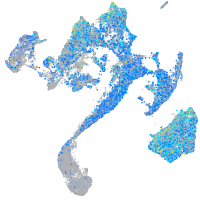
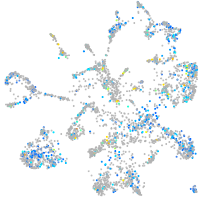
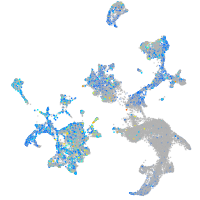
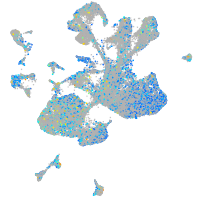
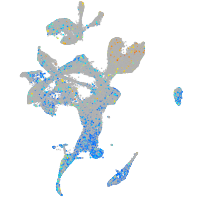
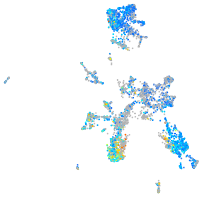
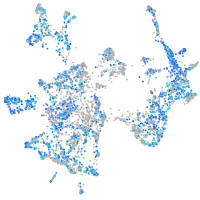
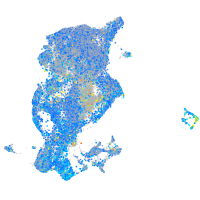
Expression by stage/cluster
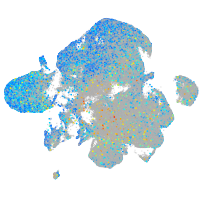
Correlated gene expression
| Positive correlation | Negative correlation | ||
| Gene | r | Gene | r |
| mgst3b | 0.090 | elavl3 | -0.096 |
| tomm20a | 0.087 | tmsb | -0.090 |
| vamp3 | 0.086 | myt1b | -0.084 |
| her9 | 0.086 | si:ch211-57n23.4 | -0.079 |
| anxa13 | 0.085 | zfhx3 | -0.078 |
| npm1a | 0.085 | si:ch73-386h18.1 | -0.076 |
| sept10 | 0.085 | LOC100537384 | -0.072 |
| cd63 | 0.084 | ptmaa | -0.067 |
| wls | 0.084 | stmn1b | -0.067 |
| anxa4 | 0.082 | nova2 | -0.067 |
| id1 | 0.081 | pik3r3b | -0.066 |
| si:dkey-7j14.6 | 0.081 | ptmab | -0.063 |
| dkc1 | 0.080 | chd4a | -0.063 |
| gnai2a | 0.079 | sox11b | -0.062 |
| ssr2 | 0.079 | pou2f2a | -0.061 |
| anxa11b | 0.079 | hmgb3a | -0.061 |
| crtap | 0.079 | pou3f1 | -0.060 |
| srprb | 0.079 | FO082781.1 | -0.060 |
| zfp36l1a | 0.079 | elavl4 | -0.060 |
| her6 | 0.079 | zc4h2 | -0.059 |
| lamb1a | 0.079 | LOC101882472 | -0.058 |
| tmed2 | 0.079 | baz2ba | -0.056 |
| si:ch211-286b5.5 | 0.078 | epb41a | -0.056 |
| nop58 | 0.078 | onecut1 | -0.056 |
| nifk | 0.078 | scrt2 | -0.055 |
| cnn2 | 0.078 | gng2 | -0.055 |
| si:ch211-66e2.5 | 0.078 | adcyap1b | -0.055 |
| adi1 | 0.077 | rtn1a | -0.054 |
| fosab | 0.077 | tmsb4x | -0.053 |
| ndnf | 0.076 | isl1 | -0.053 |
| hspb1 | 0.076 | myt1a | -0.051 |
| spry2 | 0.076 | ebf3a | -0.051 |
| ppib | 0.075 | tubb5 | -0.050 |
| fkbp14 | 0.075 | si:ch73-21g5.7 | -0.050 |
| si:dkey-102m7.3 | 0.075 | gng3 | -0.049 |