Daniocell
fam120b (muscle)
family with sequence similarity 120B
ZFIN
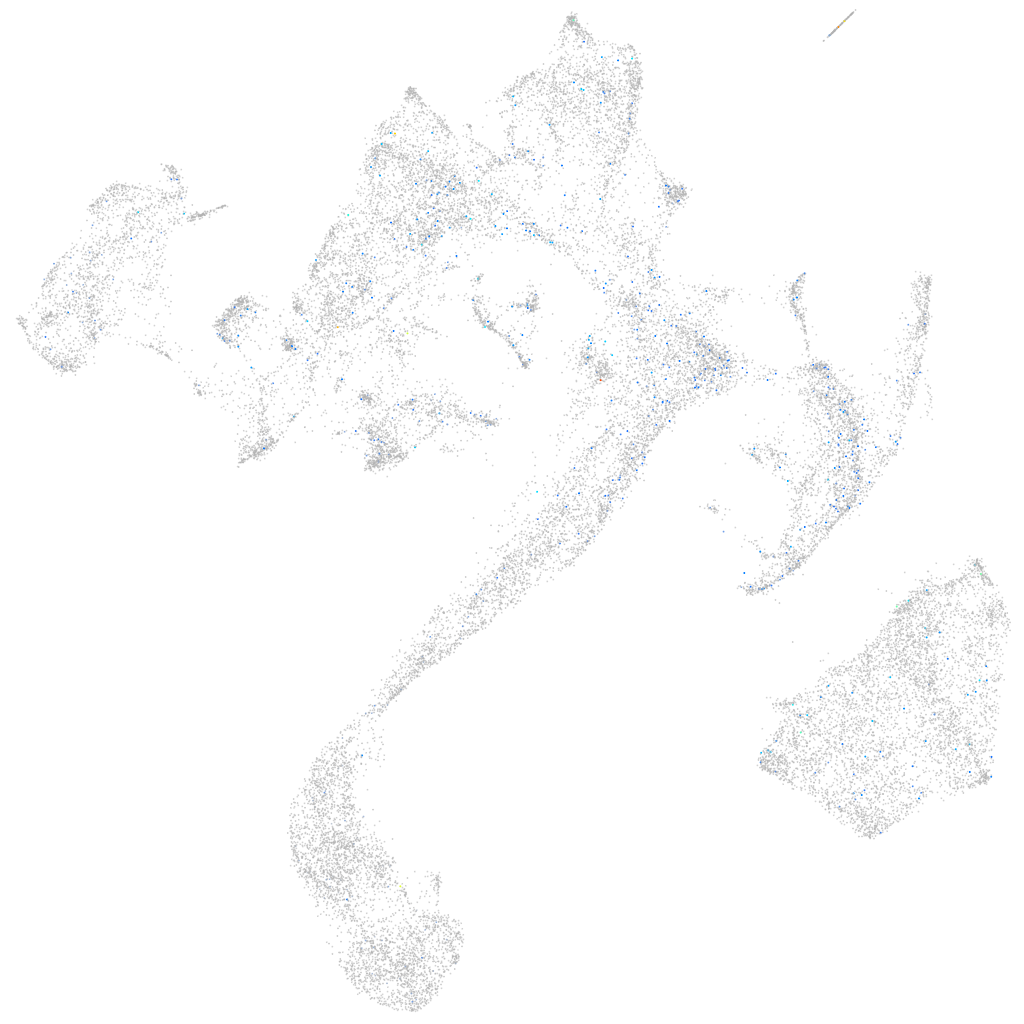
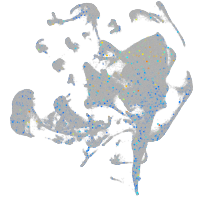
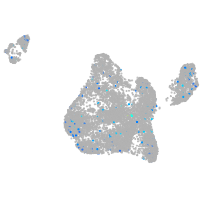
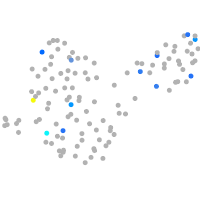
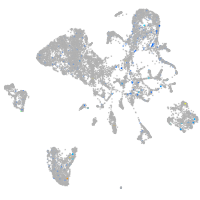
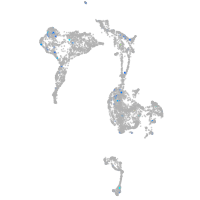
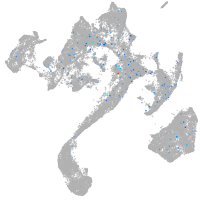
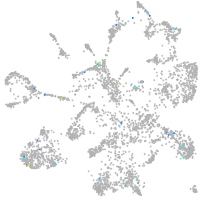
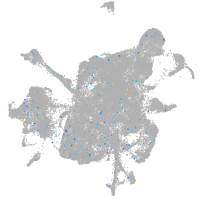
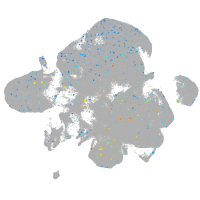
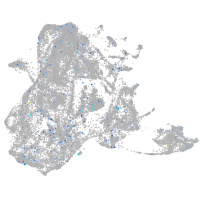
Gene expression UMAP
Display:
Expression
Stage
Other cell groups
all cells
blastomeres
PGCs
endoderm
axial mesoderm
muscle
mural cells /
non-skeletal muscle
mesenchyme
hematopoietic /
vasculature
pronephros
neural
spinal cord / glia
eye
taste / olfactory
otic / lateral line
epidermis
periderm
fin
ionocytes / mucous
pigment cells
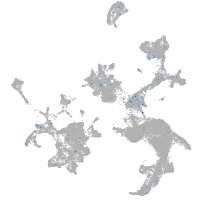
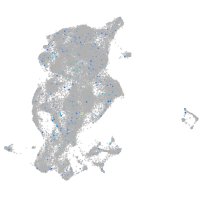
Expression by stage/cluster
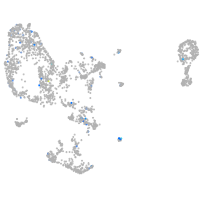
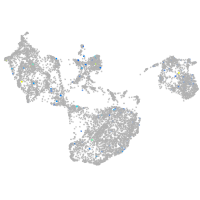
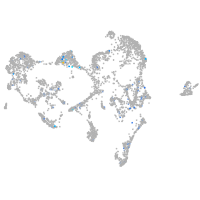
Correlated gene expression
Positive correlation
Negative correlation
Gene
r
Gene
r
zmp:0000001175
0.106
ckmb
-0.047
SPHK1
0.104
tpma
-0.046
si:dkey-65b13.1
0.093
atp2a1
-0.045
CR376740.2
0.091
actc1b
-0.045
wdr17
0.083
neb
-0.044
XLOC-023335
0.080
tmem38a
-0.043
LOC101885066
0.075
mylpfa
-0.043
LOC108190613
0.074
ak1
-0.043
si:ch211-233f11.5
0.073
tnnc2
-0.043
pimr134
0.071
ckma
-0.042
itih3b
0.066
aldoab
-0.042
bpifcl
0.064
acta1b
-0.042
capn3a
0.062
mylz3
-0.041
LO017877.1
0.059
actn3b
-0.041
CABZ01065684.1
0.058
ldb3b
-0.041
tbc1d9b
0.058
ank1a
-0.041
LOC101886979
0.058
tnnt3a
-0.041
CR385053.2
0.057
myl1
-0.041
tymp
0.057
ldb3a
-0.040
LOC110437921
0.056
si:ch73-367p23.2
-0.040
BX571839.1
0.055
hhatla
-0.040
tubb4b
0.055
cav3
-0.040
LOC103910356
0.055
actn3a
-0.040
stx11b.2
0.055
gapdh
-0.039
RGS13
0.054
srl
-0.039
si:ch211-1a19.2
0.054
smyd1a
-0.039
LOC100535772
0.053
CABZ01078594.1
-0.039
h3f3a
0.051
ttn.2
-0.039
cdh10a
0.051
casq2
-0.039
si:dkey-28i19.3
0.051
myom1a
-0.039
znf1067
0.051
tnnt3b
-0.039
ran
0.051
nme2b.2
-0.039
LOC100149554
0.051
si:ch211-266g18.10
-0.038
cntn3a.2
0.050
pvalb2
-0.038
SLC22A7 (1 of many)
0.050
gamt
-0.038