Daniocell
faima (axial mesoderm)
Fas apoptotic inhibitory molecule a
ZFIN
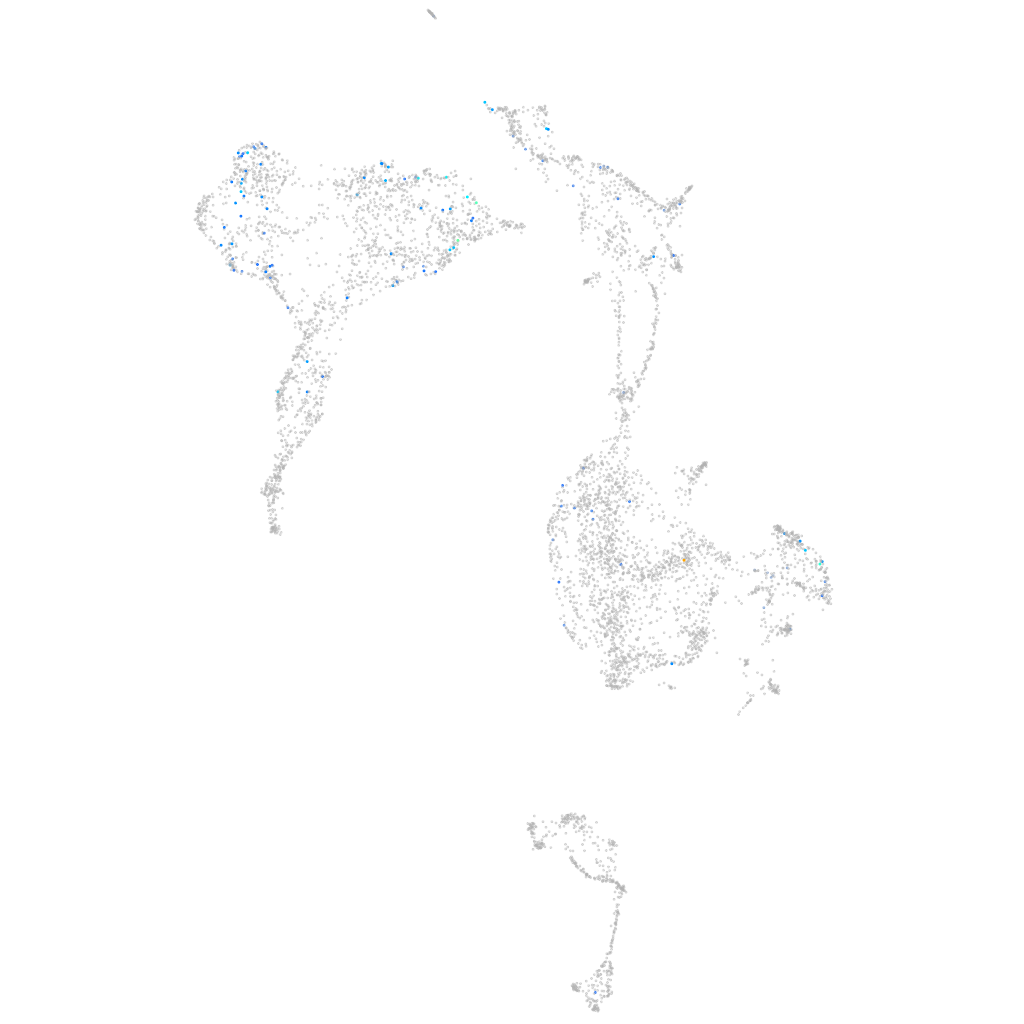
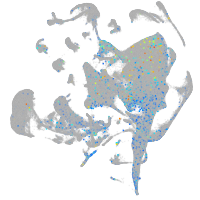
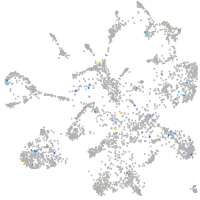
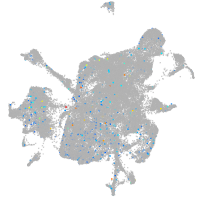
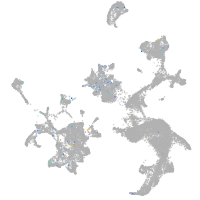
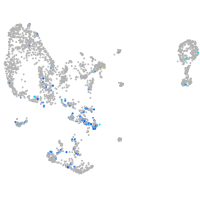
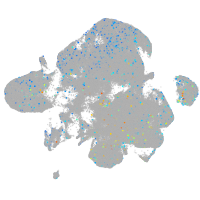
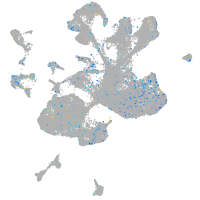
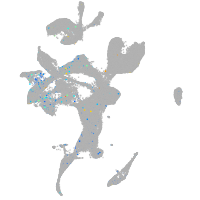
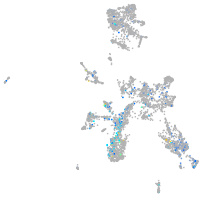
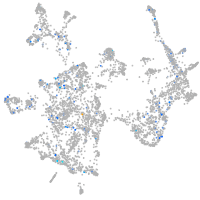
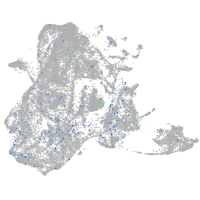
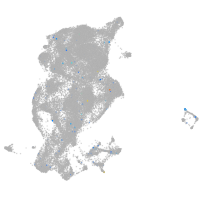
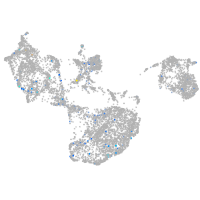
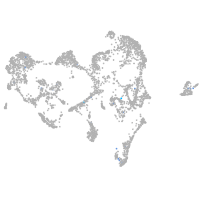
Gene expression UMAP
Display:
Expression
Stage
Other cell groups
all cells
blastomeres
PGCs
endoderm
axial mesoderm
muscle
mural cells /
non-skeletal muscle
mesenchyme
hematopoietic /
vasculature
pronephros
neural
spinal cord / glia
eye
taste / olfactory
otic / lateral line
epidermis
periderm
fin
ionocytes / mucous
pigment cells
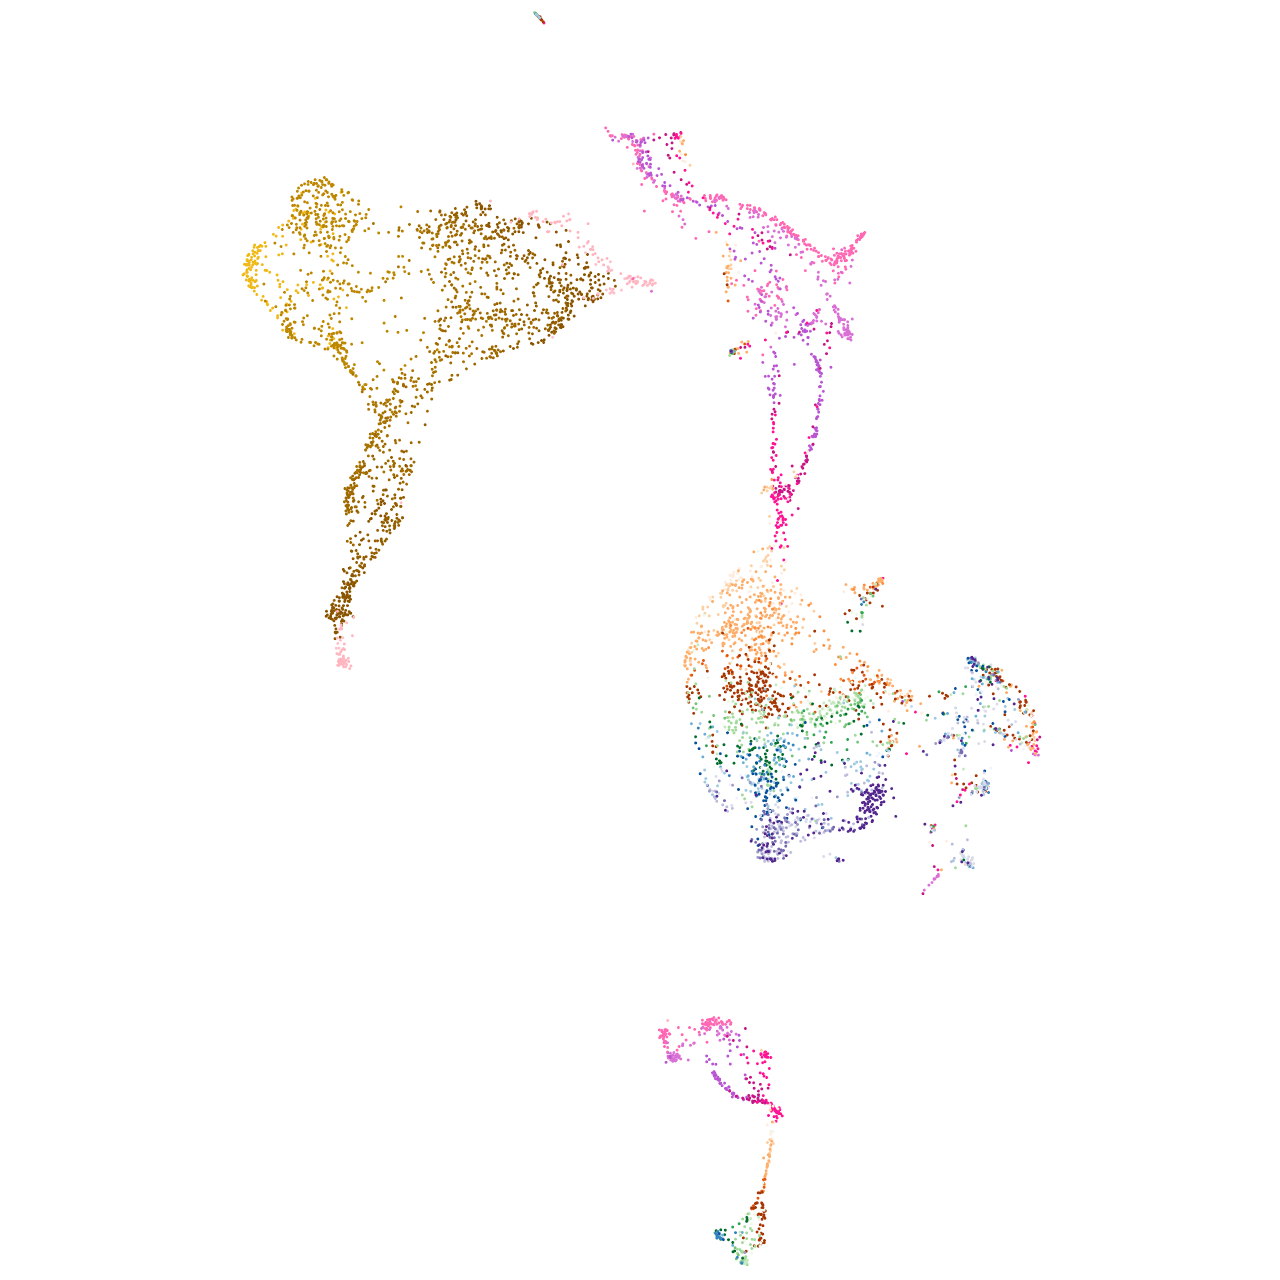
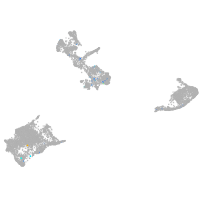
Expression by stage/cluster
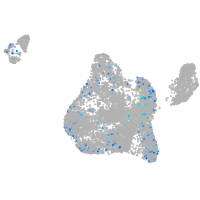
Correlated gene expression
Positive correlation
Negative correlation
Gene
r
Gene
r
BX901974.2
0.188
krt8
-0.079
si:rp71-17i16.4
0.184
sparc
-0.075
BX005275.2
0.156
zgc:114188
-0.075
ferd3l
0.148
rpl37
-0.075
LOC110438837
0.142
rps10
-0.074
si:dkey-79f11.9
0.140
col2a1a
-0.069
marco
0.137
rps17
-0.069
si:dkeyp-86f7.4
0.135
col9a2
-0.068
BX465834.1
0.126
col9a1b
-0.068
mep1a.2
0.125
col9a3
-0.067
BX957276.1
0.121
zgc:113232
-0.066
crygm2d3
0.120
cmn
-0.066
CR318599.2
0.120
zmp:0000000760
-0.066
LOC108183642
0.120
col11a1a
-0.066
CR556709.1
0.118
agtrap
-0.065
cyp2aa9
0.118
zgc:162730
-0.064
cacna1fb
0.116
krt18a.1
-0.064
BX571827.2
0.113
si:ch73-23l24.1
-0.063
or128-6
0.113
rps2
-0.063
LOC103909472
0.111
col11a2
-0.062
LOC110438250
0.111
cnmd
-0.062
cfap157
0.108
jun
-0.061
tmem204
0.108
zgc:158463
-0.059
scaf4a
0.106
rps25
-0.059
zgc:174624
0.105
ucmab
-0.058
si:dkey-156m2.3
0.104
matn3a
-0.058
sf3b5
0.103
gas2b
-0.058
LOC110437985
0.101
prdx4
-0.058
marcksb
0.099
anxa2a
-0.057
fnbp1l
0.098
rplp1
-0.057
sc:d189
0.098
col8a1a
-0.057
hdac1
0.097
susd5
-0.057
cfap53
0.097
si:dkey-12l12.1
-0.056
pex2
0.097
krt5
-0.056
zgc:77056
0.097
epyc
-0.056