Daniocell
fabp7a (blastomeres)
"fatty acid binding protein 7, brain, a"
ZFIN
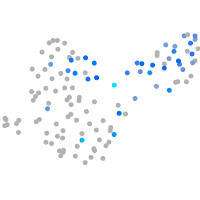
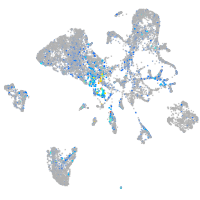
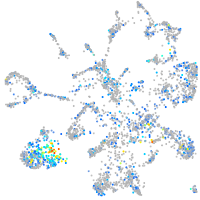
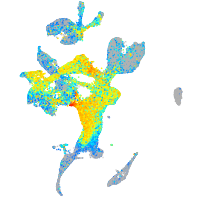
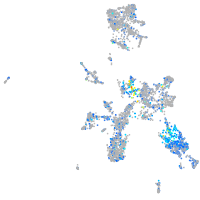
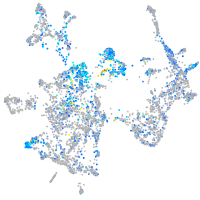
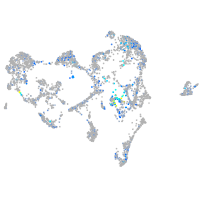
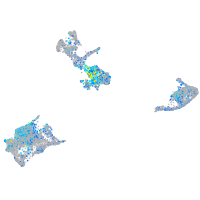
Gene expression UMAP
Display:
Expression
Stage
Other cell groups
all cells
blastomeres
PGCs
endoderm
axial mesoderm
muscle
mural cells /
non-skeletal muscle
mesenchyme
hematopoietic /
vasculature
pronephros
neural
spinal cord / glia
eye
taste / olfactory
otic / lateral line
epidermis
periderm
fin
ionocytes / mucous
pigment cells
Expression by stage/cluster
Correlated gene expression
Positive correlation
Negative correlation
Gene
r
Gene
r
sdsl
0.108
NC-002333.4
-0.047
CR376857.1
0.107
si:ch211-133n4.4
-0.038
AL954322.3
0.102
gas8
-0.031
scgn
0.097
zgc:92335
-0.030
si:ch211-1f22.2
0.095
osr1
-0.028
LOC103909969
0.092
ccnf
-0.028
LOC101886239
0.091
lft1
-0.028
mep1a.1
0.086
zgc:153018
-0.026
gal3st2
0.086
lhx1a
-0.026
wu:fc38h03
0.084
nudt22
-0.026
CR788316.2
0.084
prelid1a
-0.025
ankrd31
0.083
BX088707.1
-0.024
si:dkey-246g23.4
0.082
LOC108190134
-0.024
LOC110439573
0.082
map1lc3a
-0.024
BX005005.1
0.080
poglut1
-0.024
CR855311.1
0.080
histh1l
-0.024
or111-11
0.079
tprg1
-0.024
sox1b
0.079
msantd1
-0.024
nrl
0.079
dtd2
-0.024
CR352253.1
0.075
snx12
-0.024
si:dkey-238i5.2
0.074
hmgn2
-0.024
LOC101886835
0.074
enc1
-0.023
RF00045
0.074
lhx5
-0.023
stx1a
0.073
tmem97
-0.023
LOC100334487
0.073
hes6
-0.023
mmp28
0.072
efnb2a
-0.023
CR847944.1
0.070
lims1
-0.023
abcb9
0.070
tmem63bb
-0.023
si:ch73-226i7.1
0.069
gng10
-0.023
sst6
0.069
zfand6
-0.023
eif3bb
0.069
ppp1r35
-0.023
fgf1b
0.068
ccng2
-0.022
styk1b
0.068
qtrt2
-0.022
LOC108183743
0.068
galnt7
-0.022
CABZ01030006.1
0.067
surf1
-0.022