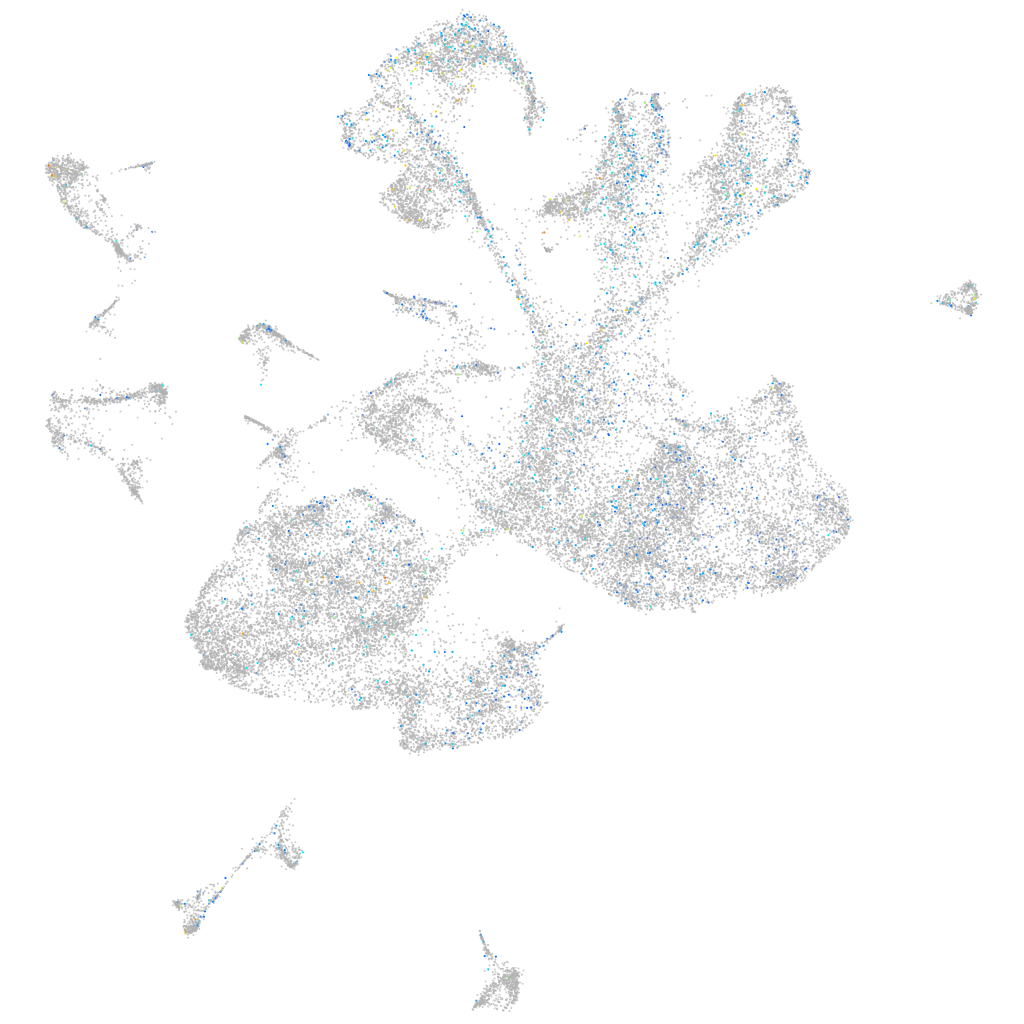
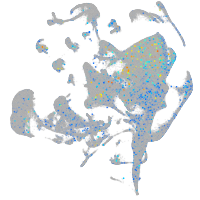
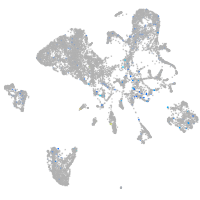
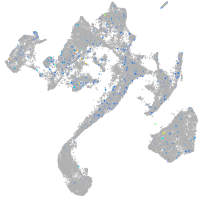
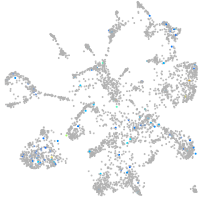
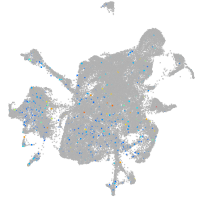
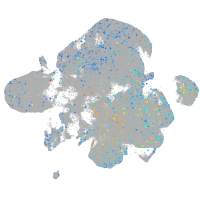
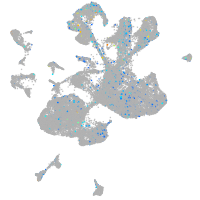
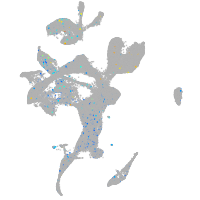
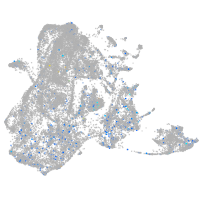
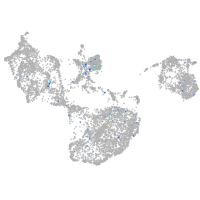
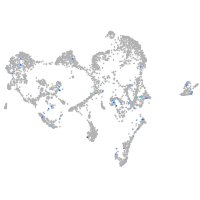
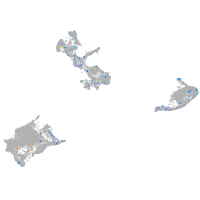
Expression by stage/cluster


Correlated gene expression


| Positive correlation | Negative correlation | ||
| Gene | r | Gene | r |
| tubb5 | 0.087 | id1 | -0.061 |
| elavl3 | 0.080 | mdka | -0.051 |
| jagn1a | 0.077 | XLOC-003690 | -0.051 |
| stxbp1a | 0.076 | sparc | -0.049 |
| cplx2 | 0.075 | atp1a1b | -0.045 |
| stx1b | 0.075 | fabp7a | -0.045 |
| atp1a3a | 0.075 | cldn5a | -0.045 |
| nsg2 | 0.075 | her15.1 | -0.044 |
| onecut1 | 0.072 | btg2 | -0.043 |
| syt2a | 0.071 | msi1 | -0.041 |
| map1b | 0.071 | cd63 | -0.041 |
| elavl4 | 0.071 | vamp3 | -0.041 |
| gng3 | 0.070 | sox3 | -0.041 |
| LOC101883290 | 0.070 | ptn | -0.040 |
| stmn2a | 0.069 | fosab | -0.039 |
| stmn2b | 0.068 | dap1b | -0.039 |
| aplp1 | 0.068 | cx43 | -0.038 |
| vamp2 | 0.066 | glula | -0.038 |
| ARHGAP22 (1 of many) | 0.066 | her6 | -0.038 |
| myt1b | 0.066 | atp1b4 | -0.037 |
| zfhx3 | 0.066 | her12 | -0.037 |
| rtn1b | 0.066 | her4.1 | -0.037 |
| ywhag2 | 0.066 | notch3 | -0.036 |
| tmeff1b | 0.066 | pgrmc1 | -0.036 |
| atp1b2a | 0.065 | ppap2d | -0.036 |
| sncb | 0.065 | gpm6bb | -0.036 |
| gap43 | 0.065 | COX7A2 (1 of many) | -0.036 |
| rtn1a | 0.064 | si:ch211-66e2.5 | -0.036 |
| zfhx4 | 0.063 | si:ch73-265d7.2 | -0.036 |
| atp6v0cb | 0.062 | si:ch73-281n10.2 | -0.036 |
| tmsb | 0.062 | slc3a2a | -0.035 |
| ywhah | 0.062 | hepacama | -0.035 |
| evlb | 0.062 | wls | -0.035 |
| tmem59l | 0.062 | ptgdsb.2 | -0.035 |
| id4 | 0.062 | her9 | -0.035 |


