
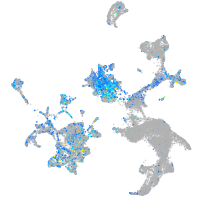
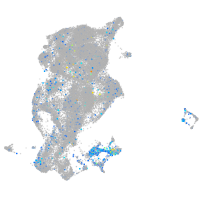
Gene expression UMAP


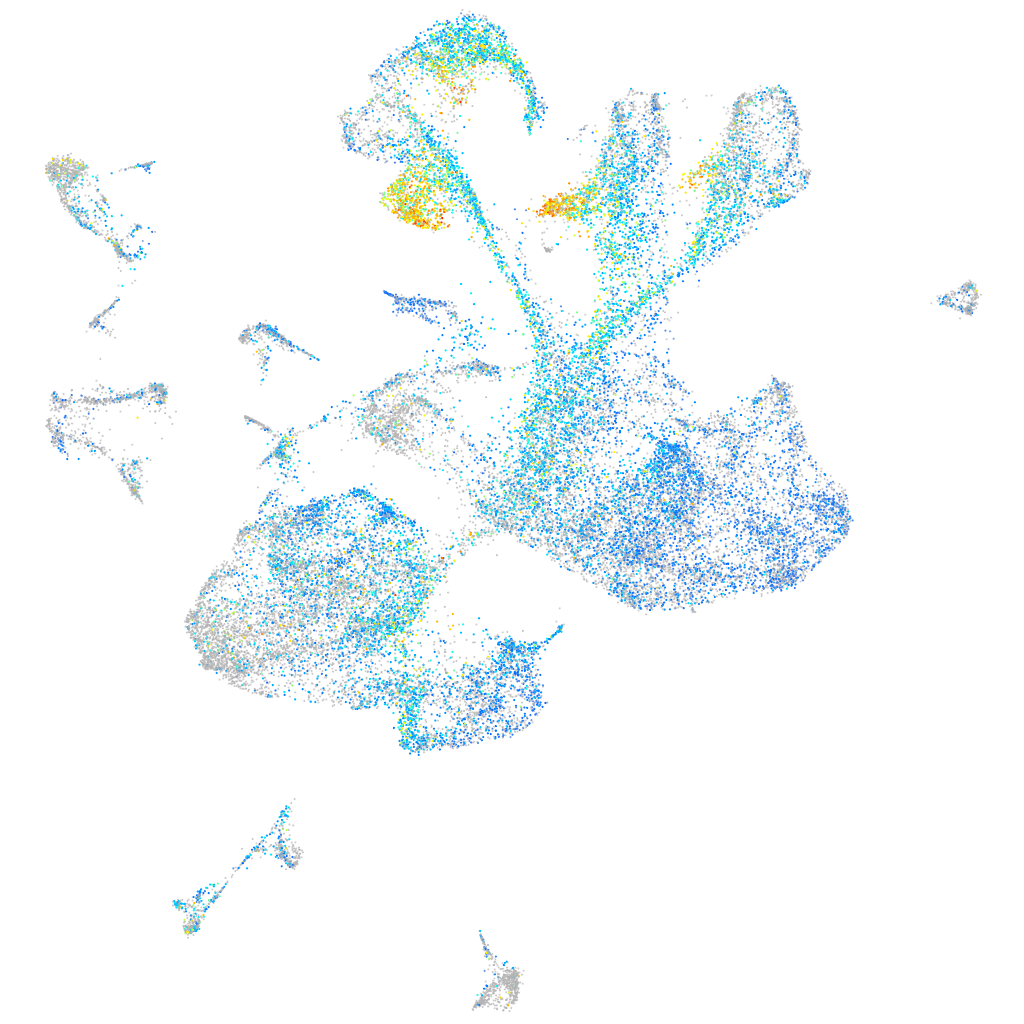


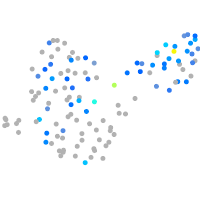
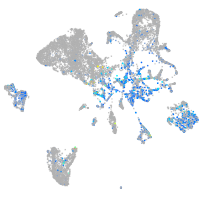
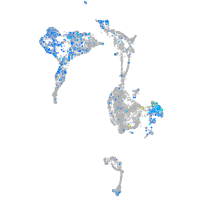


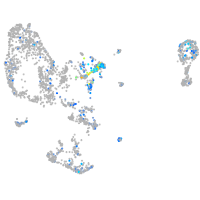


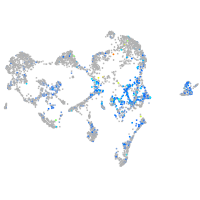

Expression by stage/cluster
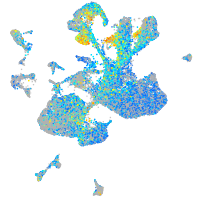
Correlated gene expression
| Positive correlation | Negative correlation | ||
| Gene | r | Gene | r |
| elavl3 | 0.366 | id1 | -0.215 |
| tmsb | 0.359 | atp1a1b | -0.203 |
| sox4a | 0.348 | fosab | -0.202 |
| pik3r3b | 0.347 | sparc | -0.202 |
| myt1b | 0.329 | mdka | -0.185 |
| stmn1b | 0.316 | qki2 | -0.166 |
| LOC100537384 | 0.303 | fabp7a | -0.165 |
| hunk | 0.297 | cx43 | -0.165 |
| sox11b | 0.281 | vamp3 | -0.164 |
| scrt2 | 0.272 | efhd1 | -0.164 |
| rtn1a | 0.269 | glula | -0.163 |
| nova2 | 0.268 | atp1b1a | -0.161 |
| epb41a | 0.255 | psph | -0.159 |
| isl1 | 0.254 | si:ch73-265d7.2 | -0.159 |
| hmgb3a | 0.248 | cd63 | -0.159 |
| zc4h2 | 0.245 | slc1a2b | -0.155 |
| sox11a | 0.245 | ppap2d | -0.154 |
| pou2f2a | 0.245 | cnn3a | -0.154 |
| nanos1 | 0.244 | si:ch211-66e2.5 | -0.153 |
| ebf3a | 0.242 | anxa13 | -0.150 |
| h3f3d | 0.239 | slc4a4a | -0.146 |
| si:ch73-386h18.1 | 0.232 | atp5mc3b | -0.146 |
| chd4a | 0.228 | sdc4 | -0.146 |
| adcyap1b | 0.227 | slc3a2a | -0.145 |
| islr2 | 0.226 | GCA | -0.144 |
| nhlh2 | 0.226 | tpm4a | -0.144 |
| tmeff1b | 0.224 | gpr37l1b | -0.143 |
| isl2a | 0.223 | si:ch211-286b5.5 | -0.143 |
| zfhx3 | 0.222 | her9 | -0.143 |
| tubb5 | 0.221 | hepacama | -0.143 |
| ankrd12 | 0.221 | ptn | -0.143 |
| isl2b | 0.218 | sept10 | -0.142 |
| lima1a | 0.217 | ccng1 | -0.139 |
| golga7ba | 0.217 | sox2 | -0.139 |
| ptmab | 0.217 | zgc:56493 | -0.138 |