Daniocell
ext1c (periderm)
exostoses (multiple) 1c
ZFIN
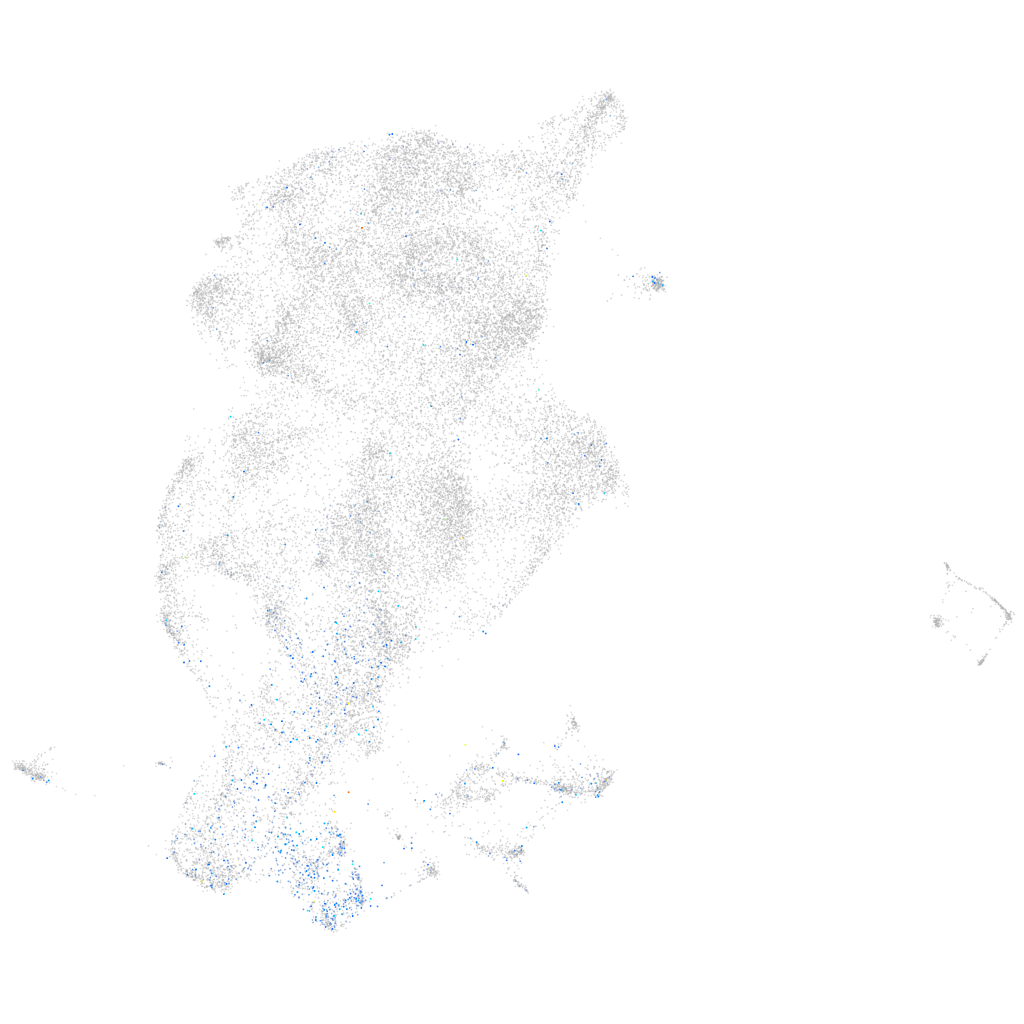
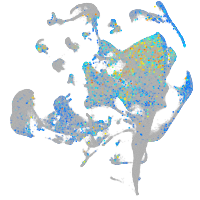
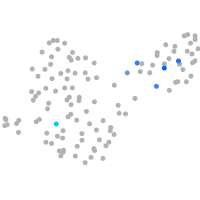
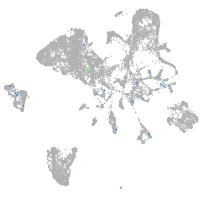
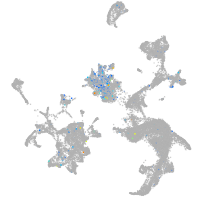
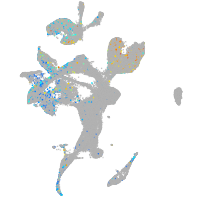
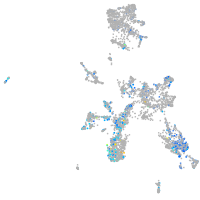
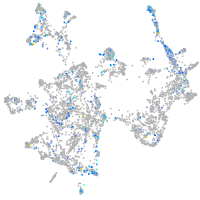
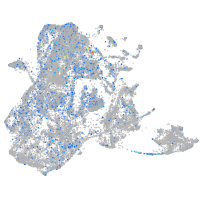
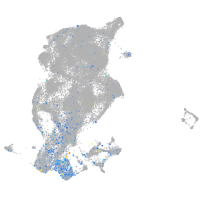
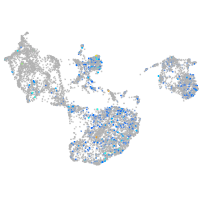
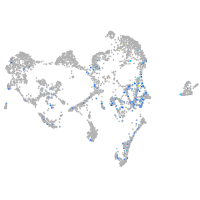
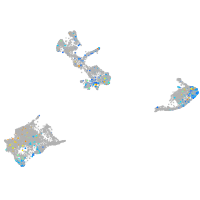
Gene expression UMAP
Display:
Expression
Stage
Other cell groups
all cells
blastomeres
PGCs
endoderm
axial mesoderm
muscle
mural cells /
non-skeletal muscle
mesenchyme
hematopoietic /
vasculature
pronephros
neural
spinal cord / glia
eye
taste / olfactory
otic / lateral line
epidermis
periderm
fin
ionocytes / mucous
pigment cells
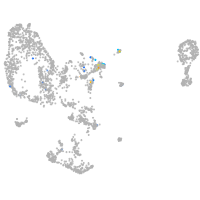
Expression by stage/cluster
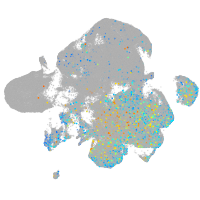
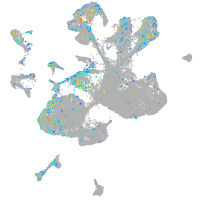
Correlated gene expression
Positive correlation
Negative correlation
Gene
r
Gene
r
krt92
0.227
tcnbb
-0.152
krt18a.1
0.216
si:ch211-207n23.2
-0.124
uox
0.191
wu:fa03e10
-0.115
tgm1l4
0.181
rplp2
-0.115
XLOC-032526
0.179
si:dkey-247k7.2
-0.111
cyp2aa8
0.177
si:dkeyp-51b9.3
-0.103
ponzr5
0.173
nme2b.1
-0.103
krt99
0.165
eef1da
-0.102
ankrd31
0.158
rps29
-0.100
BX927258.1
0.155
krtt1c19e
-0.098
chrna5
0.153
selenow2b
-0.093
krt8
0.149
rpl36a
-0.086
si:ch1073-155h21.1
0.147
uba52
-0.086
XLOC-039121
0.146
si:dkeyp-1h4.6
-0.085
ptgs1
0.143
rhbg
-0.085
hmga1a
0.141
rpl31
-0.085
si:ch211-147d7.5
0.140
tlcd1
-0.083
ftr83
0.138
eevs
-0.082
agpat4
0.137
romo1
-0.081
cks1b
0.132
caspb
-0.079
myl12.2
0.131
si:dkey-33c14.3
-0.077
evplb
0.131
epdl1
-0.076
si:ch211-202h22.8
0.131
rpl24
-0.076
XLOC-005432
0.131
si:dkey-248g15.3
-0.075
mboat1
0.130
cdc34a
-0.075
LOC100330864
0.129
rpl21
-0.074
si:ch73-281n10.2
0.129
b2ml
-0.074
zgc:92749
0.129
rps21
-0.073
dnase1l4.1
0.128
rplp1
-0.073
h3f3a
0.128
rpl18a
-0.072
capn9
0.127
rpl39
-0.071
ubxn8
0.127
rpl27a
-0.071
tex36
0.127
icn2
-0.071
LOC100535067
0.127
rps25
-0.071
ywhaz
0.126
glo1
-0.071