Daniocell
eva1a (pigment cells)
eva-1 homolog A (C. elegans)
ZFIN
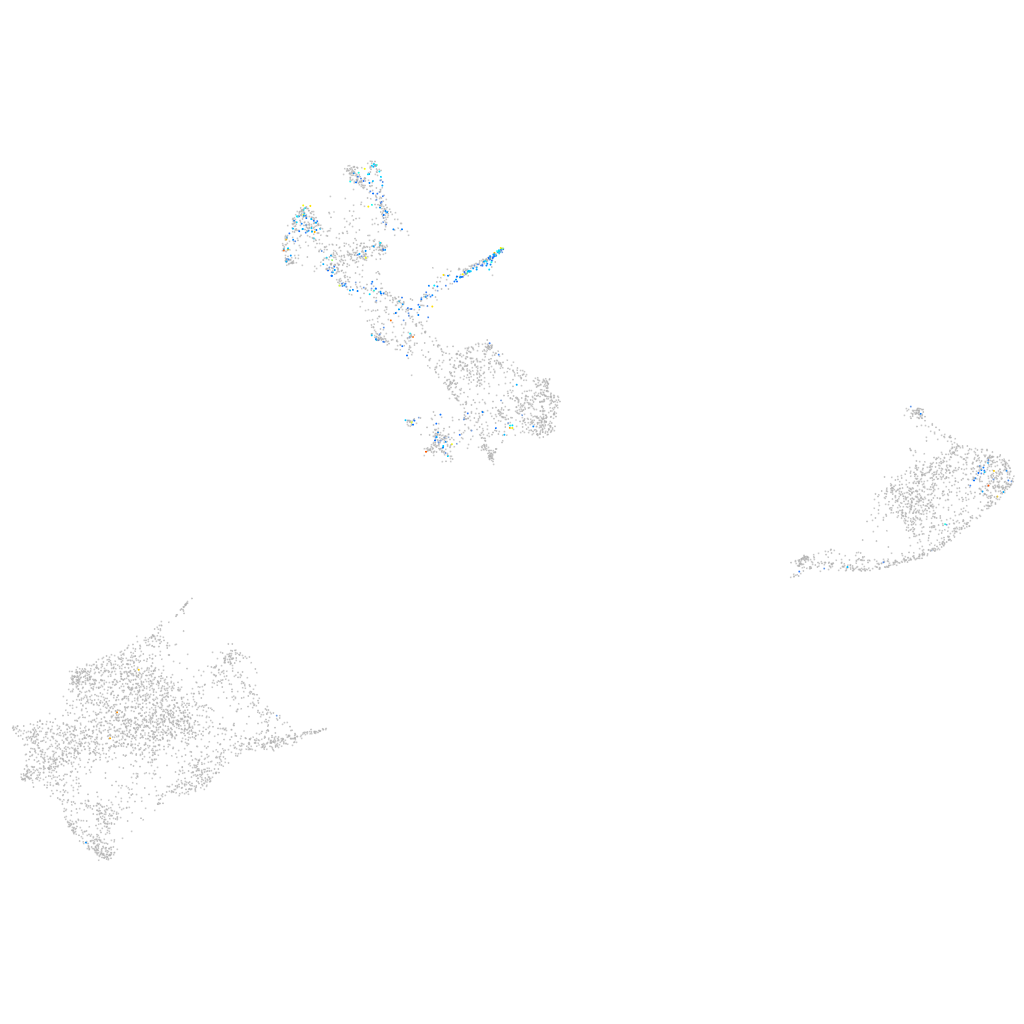
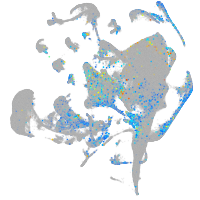
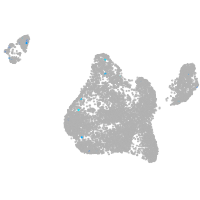
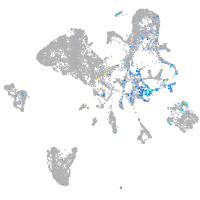
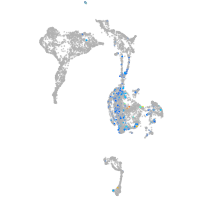
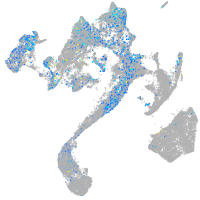
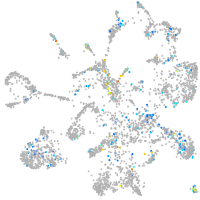
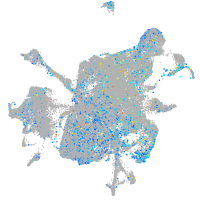
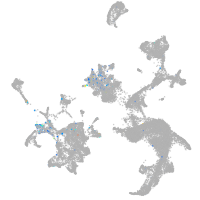
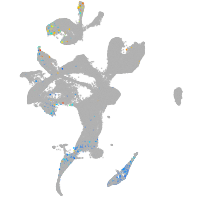
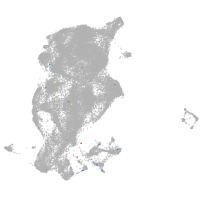
Gene expression UMAP
Display:
Expression
Stage
Other cell groups
all cells
blastomeres
PGCs
endoderm
axial mesoderm
muscle
mural cells /
non-skeletal muscle
mesenchyme
hematopoietic /
vasculature
pronephros
neural
spinal cord / glia
eye
taste / olfactory
otic / lateral line
epidermis
periderm
fin
ionocytes / mucous
pigment cells
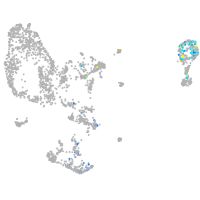
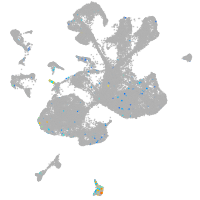
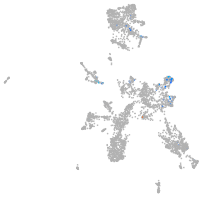
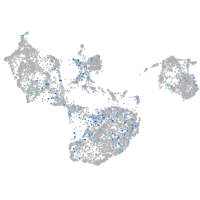
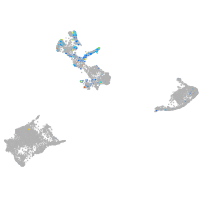
Expression by stage/cluster
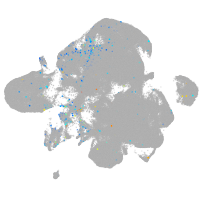
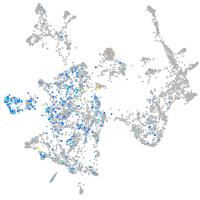
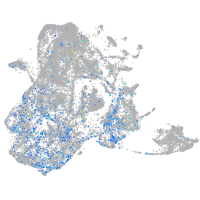
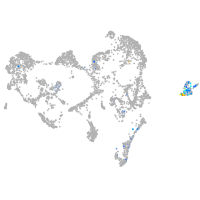
Correlated gene expression
Positive correlation
Negative correlation
Gene
r
Gene
r
elovl1a
0.299
gch2
-0.222
defbl1
0.293
CABZ01021592.1
-0.184
alx4a
0.292
pts
-0.173
si:ch211-256m1.8
0.285
slc22a7a
-0.164
apodb
0.283
si:dkey-251i10.2
-0.154
XLOC-024231
0.279
gstp1
-0.154
si:ch73-89b15.3
0.279
akr1b1
-0.148
tgfa
0.279
zgc:110339
-0.128
apoda.1
0.271
tmem130
-0.127
si:ch211-105c13.3
0.271
rtn1b
-0.125
cyp2k19
0.269
slc2a11b
-0.122
alx1
0.266
cotl1
-0.120
si:dkey-30j16.3
0.264
aox5
-0.116
tmem179b
0.263
cd63
-0.113
unm-sa821
0.261
gpd1b
-0.112
gpnmb
0.255
pcbd1
-0.108
crip1
0.254
aldob
-0.107
ada2b
0.253
si:ch211-251b21.1
-0.106
CR318624.2
0.244
aqp3a
-0.104
CABZ01055365.1
0.244
prdx1
-0.101
ltk
0.240
bscl2l
-0.100
map1lc3c
0.238
pax7b
-0.099
CABZ01074363.1
0.232
gpm6ab
-0.098
s100v2
0.230
bco1
-0.094
alx4b
0.229
cax1
-0.094
guk1a
0.229
C12orf75
-0.093
met
0.228
si:ch211-194k22.8
-0.092
myof
0.226
qdpra
-0.091
si:ch211-243a20.3
0.225
tmem243a
-0.091
lypc
0.224
sprb
-0.090
prx
0.224
cx30.3
-0.089
LOC103909099
0.224
si:dkey-56m19.5
-0.084
cyp4t8
0.224
actb2
-0.082
znf385b
0.222
zgc:113337
-0.082
XLOC-022034
0.219
rbp4l
-0.081