Daniocell
etaa1 (taste / olfactory)
ETAA1 activator of ATR kinase
ZFIN
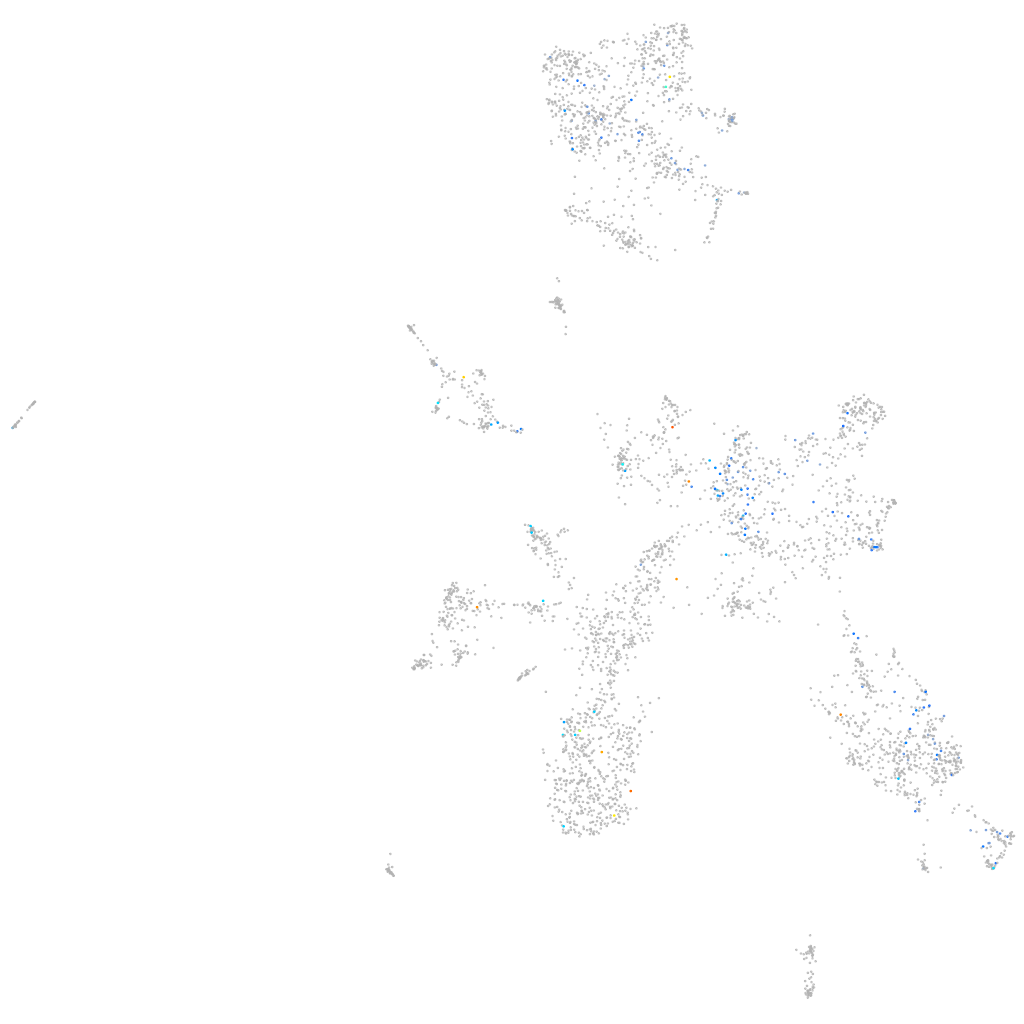
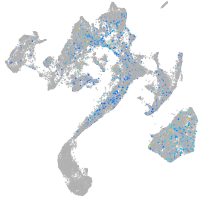
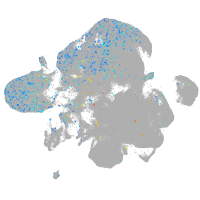
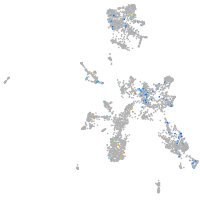
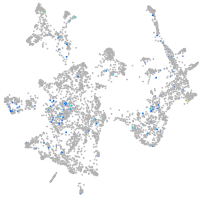
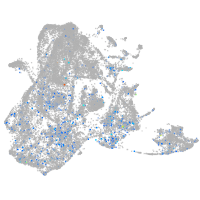
Gene expression UMAP
Display:
Expression
Stage
Other cell groups
all cells
blastomeres
PGCs
endoderm
axial mesoderm
muscle
mural cells /
non-skeletal muscle
mesenchyme
hematopoietic /
vasculature
pronephros
neural
spinal cord / glia
eye
taste / olfactory
otic / lateral line
epidermis
periderm
fin
ionocytes / mucous
pigment cells
Expression by stage/cluster
Correlated gene expression
Positive correlation
Negative correlation
Gene
r
Gene
r
XLOC-044290
0.264
itm2ba
-0.055
LOC110439879
0.232
reep5
-0.053
cnr2
0.229
calm1a
-0.053
BX901898.2
0.227
kdm6bb
-0.052
LOC110438507
0.196
stxbp2
-0.047
CT990561.2
0.196
cdc42l
-0.047
si:dkey-11e23.9
0.193
bsg
-0.046
pcdh1g31
0.186
gabarapa
-0.046
LOC101886896
0.184
tnni2a.4
-0.045
si:zfos-1897c11.1
0.174
camk2g1
-0.044
tlr5a
0.174
creb3l3l
-0.044
cacnb4a
0.170
ppp2r5eb
-0.043
ect2
0.165
max
-0.043
XLOC-041558
0.163
vps28
-0.043
kcnk4a
0.157
lamp2
-0.042
acsbg1
0.152
fam49bb
-0.042
brinp3a.2
0.148
mgst3b
-0.041
wbp4
0.148
tssc4
-0.041
BX005275.2
0.142
ywhaba
-0.041
ftr98
0.142
CABZ01112656.1
-0.041
CR388077.1
0.140
dmxl2
-0.040
LOC108180218
0.139
taf12
-0.040
si:ch73-281i18.6
0.137
ywhaqb
-0.040
LOC108190785
0.136
tuba2
-0.040
nmd3
0.136
carhsp1
-0.040
LOC100536156
0.135
gng5
-0.040
LOC103908680
0.134
cplx2
-0.039
BX469925.3
0.134
gsnb
-0.039
ctsll
0.131
hsp90b1
-0.039
CABZ01085195.1
0.131
NC-002333.17
-0.039
cks1b
0.129
si:dkey-27b3.2
-0.039
gins3
0.126
ndufb4
-0.039
ubxn2a
0.125
spred2b
-0.039
hist1h4l
0.125
pls3
-0.039
ZNF335
0.125
trappc3
-0.038