Daniocell
esm1 (periderm)
endothelial cell-specific molecule 1
ZFIN
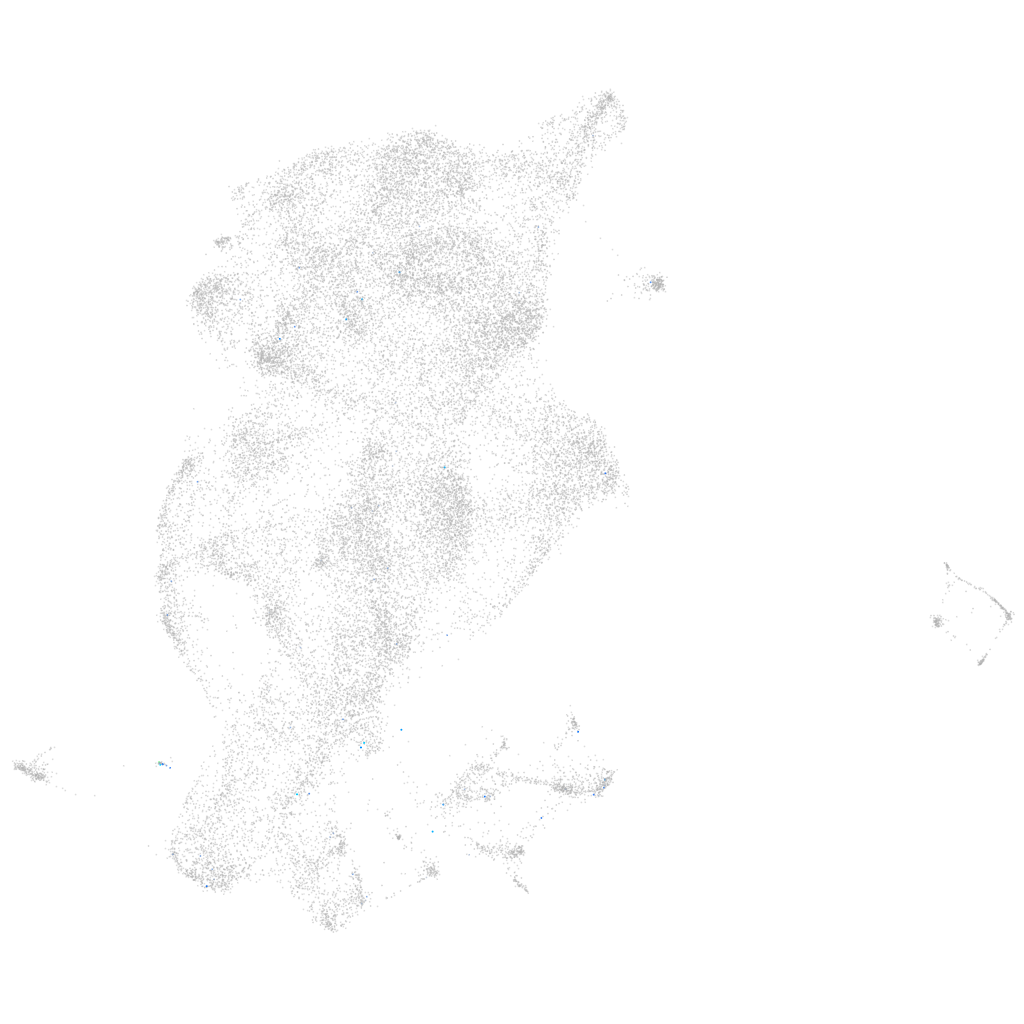
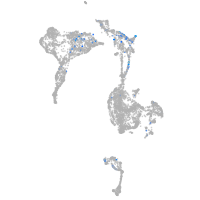
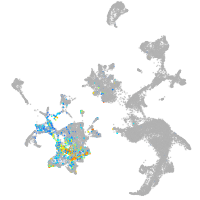
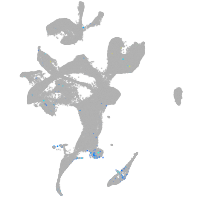
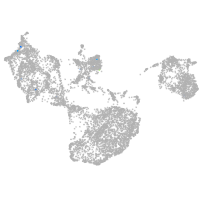
Gene expression UMAP
Display:
Expression
Stage
Other cell groups
all cells
blastomeres
PGCs
endoderm
axial mesoderm
muscle
mural cells /
non-skeletal muscle
mesenchyme
hematopoietic /
vasculature
pronephros
neural
spinal cord / glia
eye
taste / olfactory
otic / lateral line
epidermis
periderm
fin
ionocytes / mucous
pigment cells
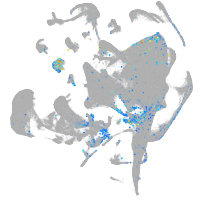
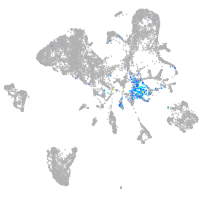
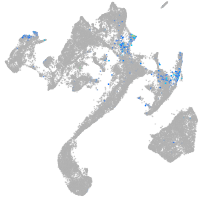
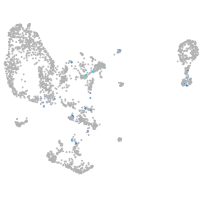
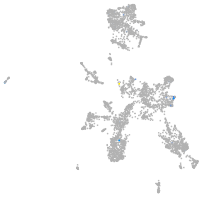
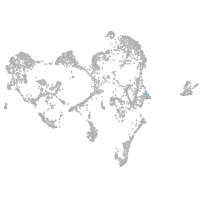
Expression by stage/cluster
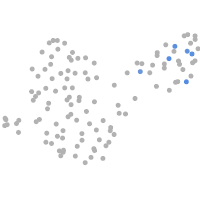
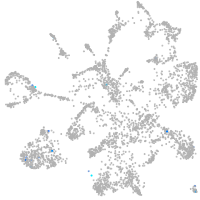
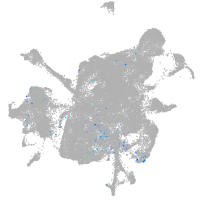
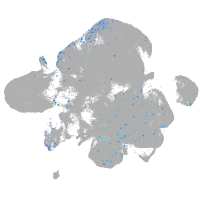
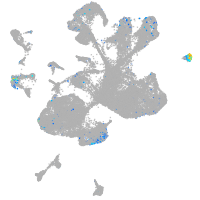
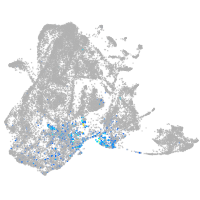
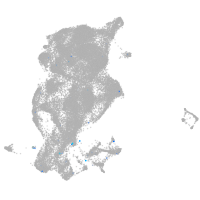
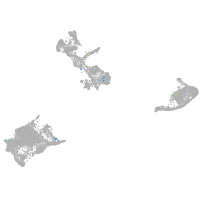
Correlated gene expression
Positive correlation
Negative correlation
Gene
r
Gene
r
XLOC-043370
0.399
cdc34a
-0.023
scarf1
0.278
eef1da
-0.022
LOC560461
0.265
tmem176l.4
-0.020
si:ch211-202m22.1
0.241
tuft1a
-0.019
tmem88a
0.230
nme2b.1
-0.019
CU927890.1
0.227
ip6k2a
-0.018
si:ch73-256j6.6
0.219
si:ch211-207n23.2
-0.018
BX276103.1
0.213
xkr8.2
-0.018
LOC103911728
0.212
ndufaf2
-0.018
exoc3l2a
0.205
eevs
-0.018
tie1
0.197
s100v2
-0.018
heg1
0.190
fbp1a
-0.017
si:dkey-12f6.5
0.183
zgc:171566
-0.017
LOC110440109
0.180
vps4b
-0.017
chst12b
0.178
dnajc19
-0.017
slc22a7b.2
0.176
dhrs13a.2
-0.017
si:dkey-7e14.3
0.175
tlcd1
-0.017
flt1
0.165
spint2
-0.017
LOC103908899
0.164
apodb
-0.016
BX119915.3
0.160
arhgef5
-0.016
mmrn2a
0.160
kras
-0.016
shank3b
0.160
eif4ebp3
-0.016
gata4
0.152
abcb5
-0.016
zgc:112332
0.151
sqor
-0.015
XLOC-039757
0.149
FQ323156.1
-0.015
LOC101885484
0.147
tpt1
-0.015
CR936459.1
0.144
si:dkey-33i11.9
-0.015
nkx2.5
0.142
rpl36
-0.015
egfl7
0.140
CABZ01027551.1
-0.015
XLOC-036510
0.140
pycard
-0.015
LOC103910259
0.139
si:dkey-242g16.2
-0.015
etv2
0.137
si:dkey-247k7.2
-0.015
LOC110438204
0.137
zgc:163030
-0.015
mcamb
0.137
psma6l
-0.015
pcdh12
0.136
tmem59
-0.014