Daniocell
ergic2 (ionocytes / mucous-producing)
ERGIC and golgi 2
ZFIN
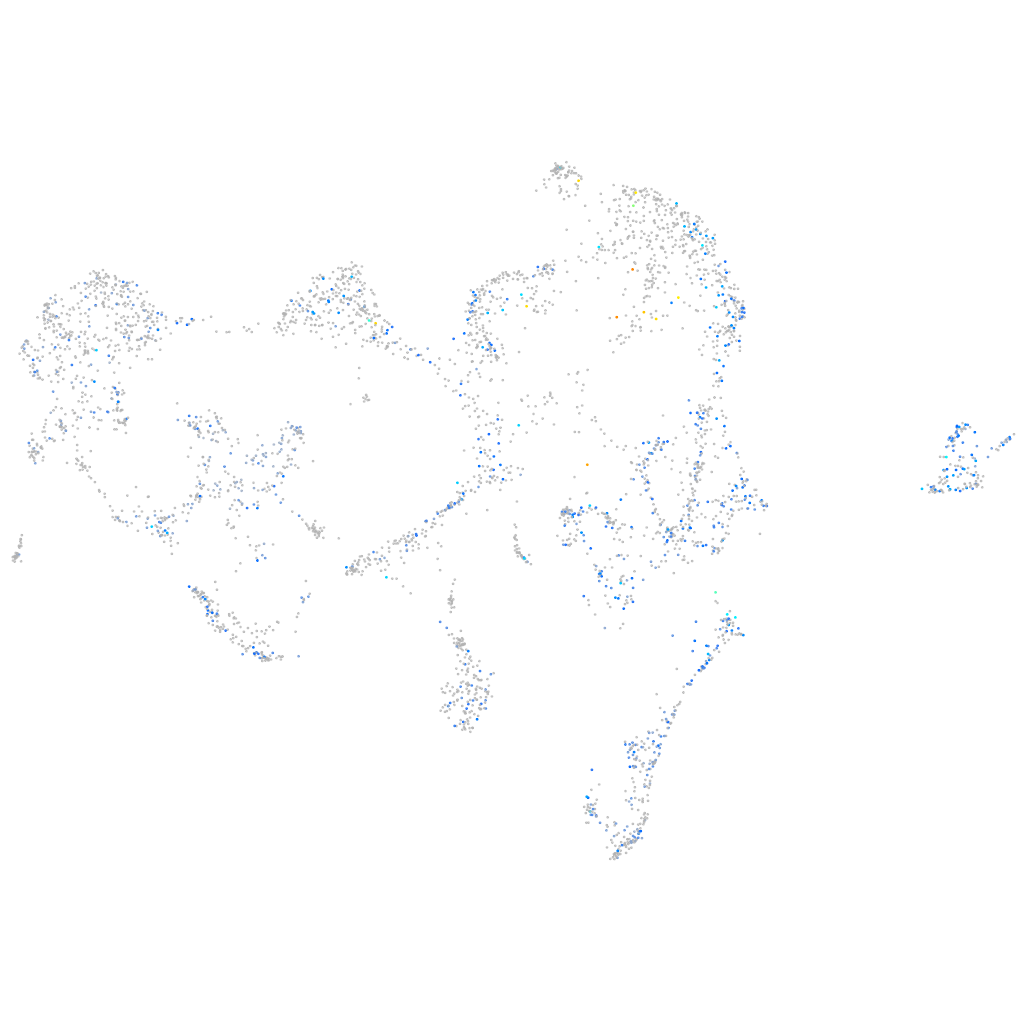
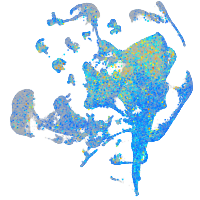
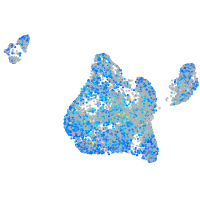
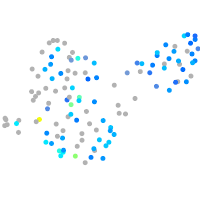
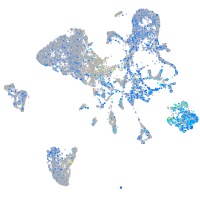
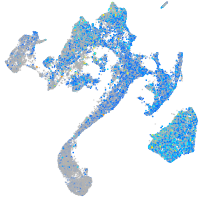
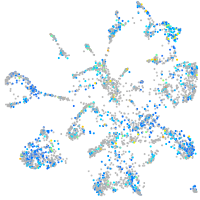
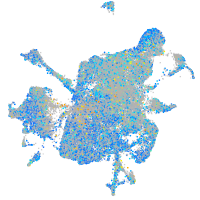
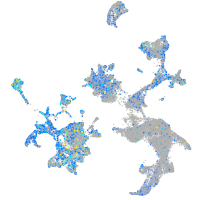
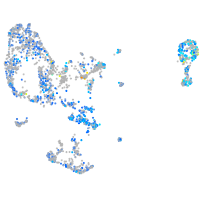
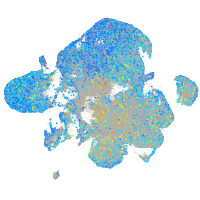
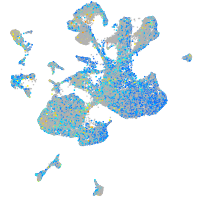
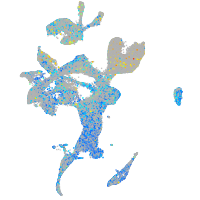
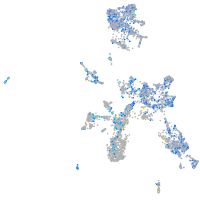
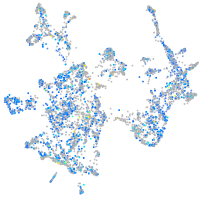
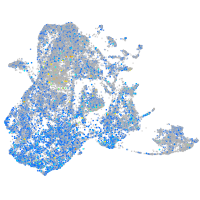
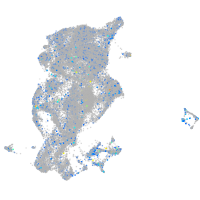
Gene expression UMAP
Display:
Expression
Stage
Other cell groups
all cells
blastomeres
PGCs
endoderm
axial mesoderm
muscle
mural cells /
non-skeletal muscle
mesenchyme
hematopoietic /
vasculature
pronephros
neural
spinal cord / glia
eye
taste / olfactory
otic / lateral line
epidermis
periderm
fin
ionocytes / mucous
pigment cells
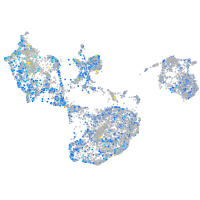
Expression by stage/cluster
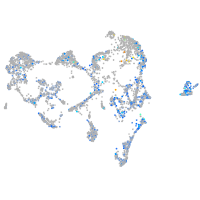
Correlated gene expression
Positive correlation
Negative correlation
Gene
r
Gene
r
si:ch211-237c6.4
0.163
si:ch211-195b11.3
-0.120
si:dkey-26g8.4
0.162
icn2
-0.109
si:ch1073-100f3.2
0.161
wu:fb18f06
-0.102
hnrnpabb
0.161
tdh
-0.097
si:ch211-222l21.1
0.152
si:dkey-248g15.3
-0.094
crtac1b
0.146
abcb5
-0.093
ptmaa
0.146
agr1
-0.092
ptmab
0.145
zgc:193505
-0.092
sap18
0.145
krt17
-0.092
hmgb1b
0.143
scel
-0.092
snrpe
0.134
si:dkey-184p9.7
-0.092
LOC101882916
0.134
soul2
-0.089
flot2a
0.133
selenow2b
-0.089
crtap
0.133
si:ch211-157c3.4
-0.086
hmgb2b
0.132
si:dkey-193p11.2
-0.086
cbx3a
0.132
abca12
-0.085
XLOC-022188
0.131
si:cabz01007794.1
-0.085
hnrnpaba
0.131
BX548046.2
-0.084
kcnb2
0.131
evpla
-0.084
polr2i
0.131
mgst1.2
-0.082
large2
0.131
znf185
-0.082
hmgn6
0.130
rplp2
-0.082
hnrnpa0b
0.130
si:ch211-105c13.3
-0.081
hnrnpa0a
0.129
si:ch211-125o16.4
-0.081
zgc:173607
0.129
si:ch73-52f15.5
-0.080
bcam
0.129
zgc:110333
-0.080
ube2e1
0.129
si:dkey-247k7.2
-0.079
rhpn1
0.129
tcnbb
-0.079
khdrbs1a
0.129
selenow1
-0.079
msna
0.129
krt4
-0.077
hmgn2
0.129
anxa1c
-0.077
sinhcafl
0.128
zgc:153284
-0.076
psma3
0.128
mt-co1
-0.076
h3f3a
0.127
wu:fa03e10
-0.075
tmeff1b
0.127
homer2
-0.075