Daniocell
emd (blastomeres)
emerin (Emery-Dreifuss muscular dystrophy)
ZFIN
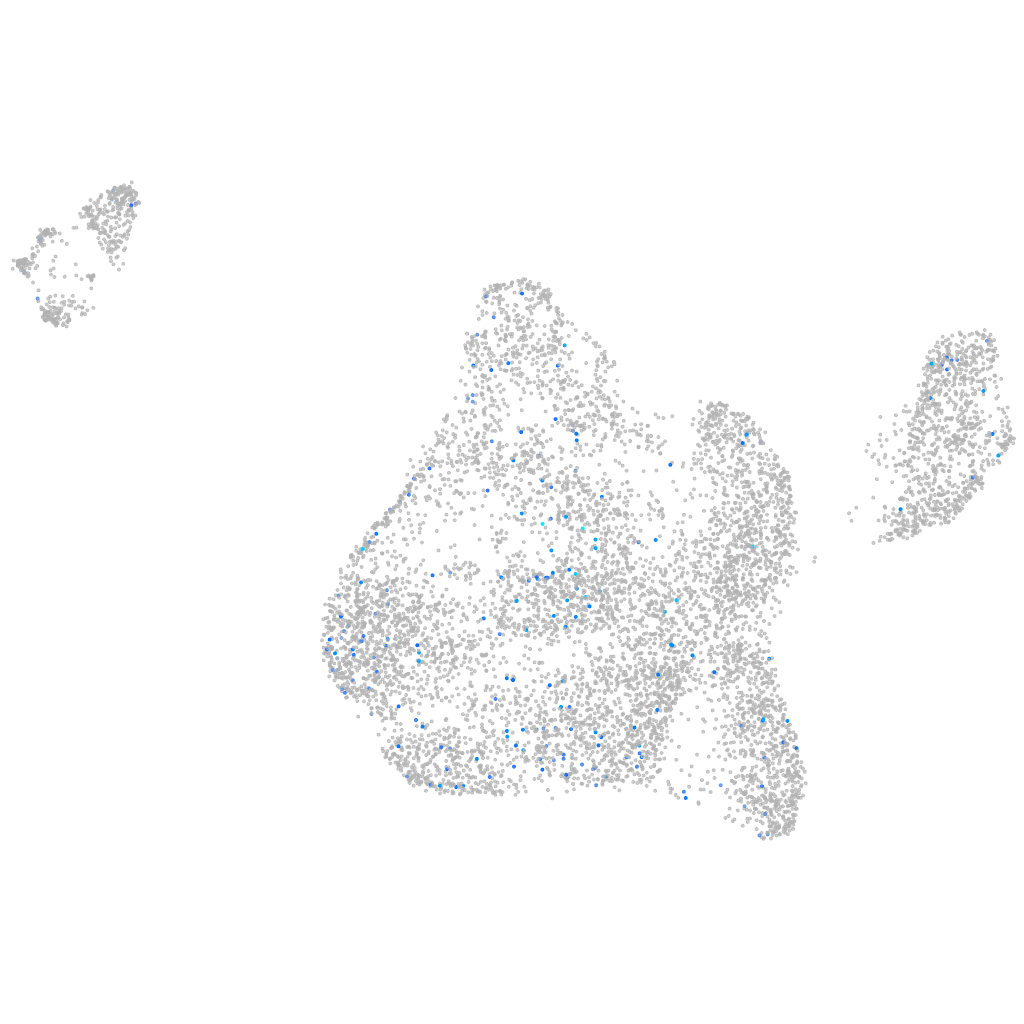
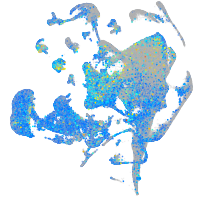
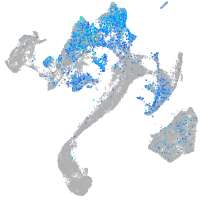
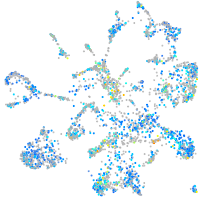
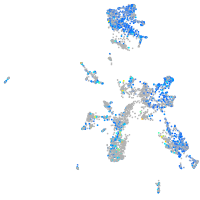
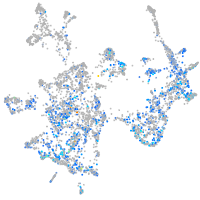
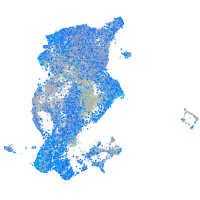
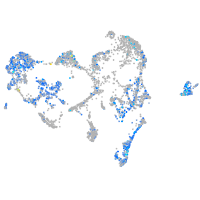
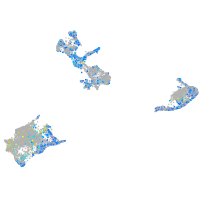
Gene expression UMAP
Display:
Expression
Stage
Other cell groups
all cells
blastomeres
PGCs
endoderm
axial mesoderm
muscle
mural cells /
non-skeletal muscle
mesenchyme
hematopoietic /
vasculature
pronephros
neural
spinal cord / glia
eye
taste / olfactory
otic / lateral line
epidermis
periderm
fin
ionocytes / mucous
pigment cells
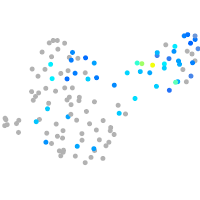
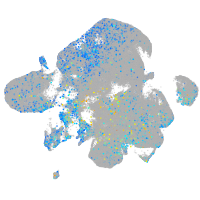
Expression by stage/cluster
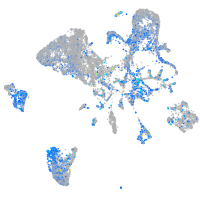
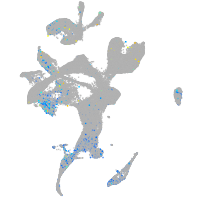
Correlated gene expression
Positive correlation
Negative correlation
Gene
r
Gene
r
LOC101885053
0.147
h1m
-0.053
LOC110438475
0.109
zgc:173742
-0.047
slc32a1
0.101
dnajc1
-0.044
htr1ab
0.099
lamp2
-0.043
LOC108181115
0.099
epcam
-0.042
XLOC-016042
0.093
si:ch73-299h12.3
-0.038
si:dkey-17m8.2
0.090
zgc:171779
-0.038
CU856343.1
0.089
spink2.1
-0.037
acvrl1
0.089
rcor1
-0.037
LOC100329825
0.089
atad1b
-0.035
si:ch211-231i17.3
0.088
si:dkey-261j4.5
-0.035
CR847983.1
0.085
pabpn1l
-0.035
slc35g2b
0.084
si:dkey-42i9.4
-0.035
CU306817.1
0.084
trmt1
-0.034
LOC103908968
0.081
fopnl
-0.034
si:ch1073-394i4.1
0.081
lman1
-0.034
rnasel2
0.081
rbpja
-0.034
XLOC-025107
0.078
si:ch211-132b12.8
-0.033
XLOC-020031
0.078
sash1a
-0.033
alas2
0.077
dnajb12a
-0.033
BX004785.2
0.076
zgc:123010
-0.032
dkk1a
0.076
nipa2
-0.032
LOC101886091
0.076
nanog
-0.032
cyp2aa6
0.075
cast
-0.032
si:dkey-78k11.4
0.073
FO834825.1
-0.032
ajap1
0.073
gdf3
-0.032
si:dkey-219e21.2
0.073
zp3d.1
-0.031
wu:fc38h03
0.073
pttg1
-0.031
nitr11a
0.072
srpk1a
-0.031
LOC558761
0.072
gnas
-0.031
LOC108182924
0.072
plpp2b
-0.031
si:ch211-278p9.2
0.071
cwf19l1
-0.031
ntng2b
0.070
tob1a
-0.031
lrrfip1b
0.070
vps25
-0.031
XLOC-007977
0.069
avd
-0.031