Daniocell
elovl1a (pronephros)
ELOVL fatty acid elongase 1a
ZFIN
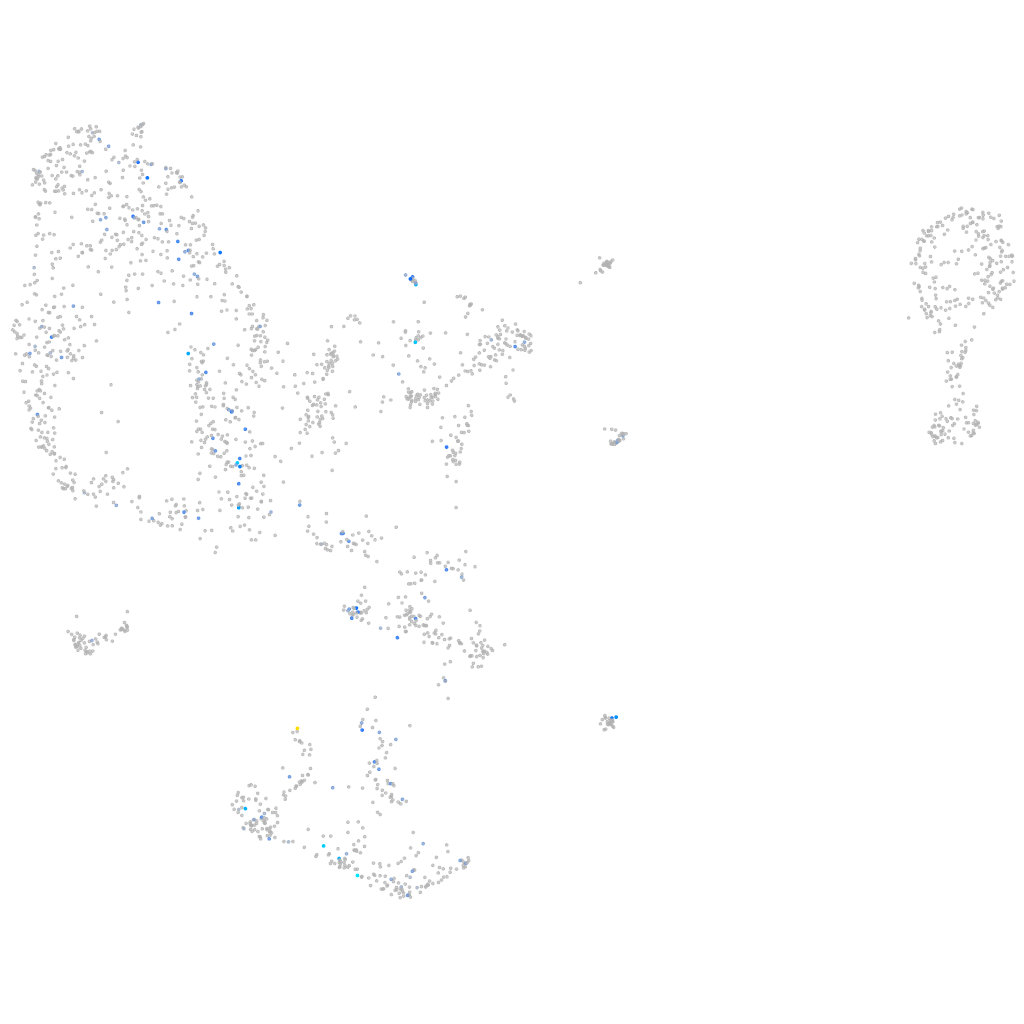
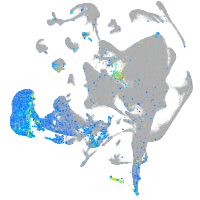
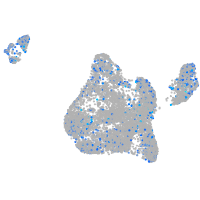
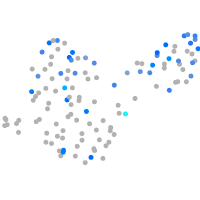
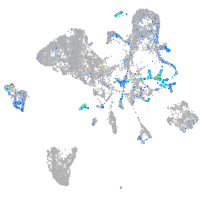
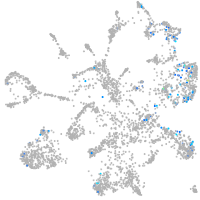
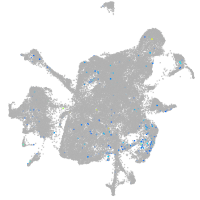
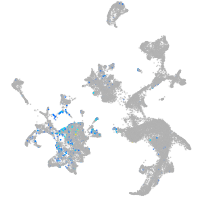
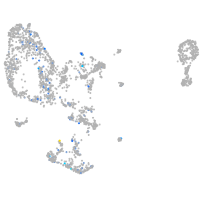
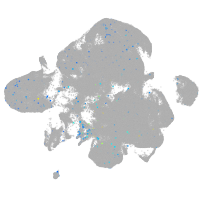
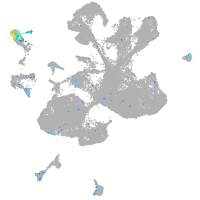
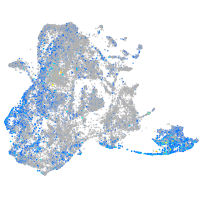
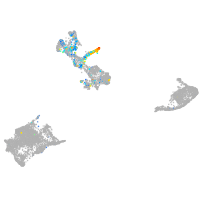
Gene expression UMAP
Display:
Expression
Stage
Other cell groups
all cells
blastomeres
PGCs
endoderm
axial mesoderm
muscle
mural cells /
non-skeletal muscle
mesenchyme
hematopoietic /
vasculature
pronephros
neural
spinal cord / glia
eye
taste / olfactory
otic / lateral line
epidermis
periderm
fin
ionocytes / mucous
pigment cells
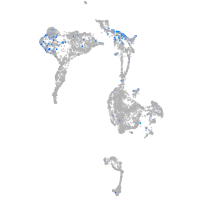
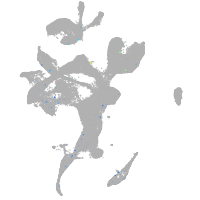
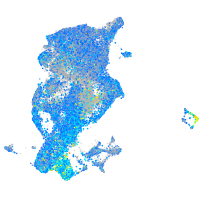
Expression by stage/cluster
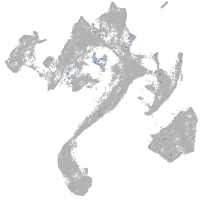
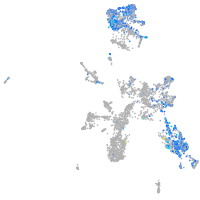
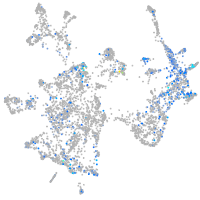
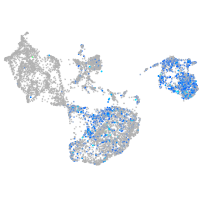
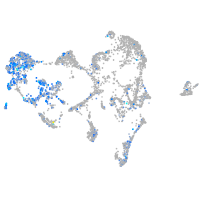
Correlated gene expression
Positive correlation
Negative correlation
Gene
r
Gene
r
crybb3
0.329
pabpc1a
-0.091
synpo2la
0.277
nop58
-0.086
LOC110440093
0.257
wu:fb97g03
-0.085
FP236513.1
0.252
hmgb1a
-0.085
si:ch211-103n10.5
0.251
apoc1
-0.084
BX569801.1
0.248
setb
-0.084
arl15b
0.214
rps6
-0.082
cxcl8b.3
0.211
ncl
-0.077
si:dkey-188i13.6
0.211
hnrnpabb
-0.077
BX539325.1
0.206
apoeb
-0.076
ptpn22
0.203
fbl
-0.075
si:ch1073-159d7.6
0.203
syncrip
-0.075
uckl1a
0.202
npm1a
-0.073
si:dkey-22i16.7
0.201
nop2
-0.073
mfap5
0.198
ptmab
-0.073
BX649620.1
0.193
marcksl1b
-0.072
CABZ01064968.1
0.192
ddx18
-0.071
fmnl1a
0.192
srsf2a
-0.070
nceh1a
0.192
hes6
-0.070
si:ch211-165i18.2
0.192
pes
-0.070
c1qtnf2
0.191
abcf1
-0.070
LOC101885341
0.191
rcc2
-0.069
CABZ01044765.1
0.183
hnrnph1l
-0.069
fbxl20
0.179
hnrnpm
-0.068
CU915762.1
0.179
rrp1
-0.068
unm-sa1506
0.177
nop56
-0.068
si:dkeyp-44a8.4
0.175
mybbp1a
-0.067
rlbp1a
0.174
eef1a1l1
-0.067
pcdh1gc5
0.173
ebna1bp2
-0.067
LOC101886811
0.172
ssb
-0.067
fbxo40.1
0.171
ilf3b
-0.067
zdhhc8a
0.171
hspb1
-0.066
TIMM22
0.170
marcksb
-0.066
CR848788.1
0.169
cdx4
-0.066
znf526
0.169
lyar
-0.066