Daniocell
elk1 (pigment cells)
ETS transcription factor ELK1
ZFIN
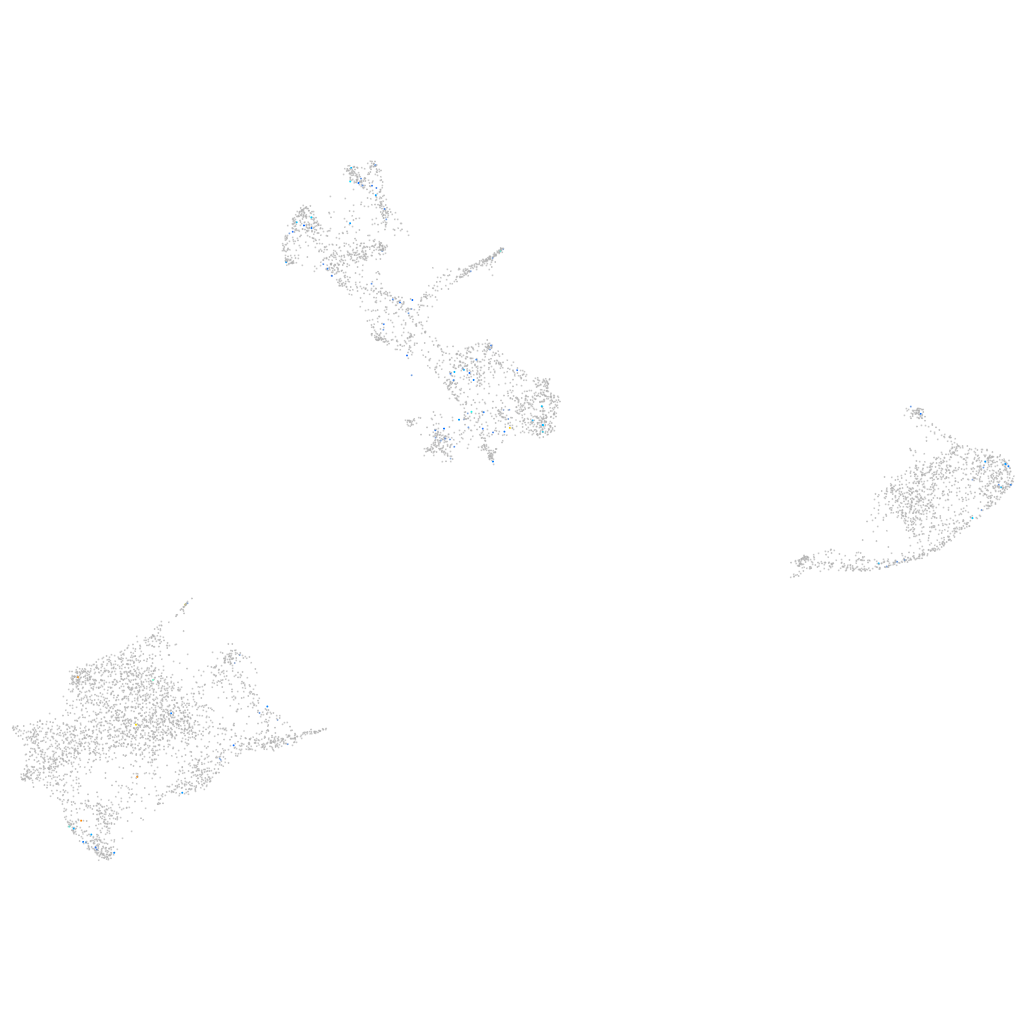
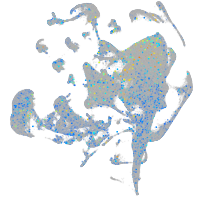
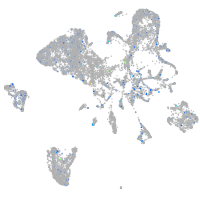
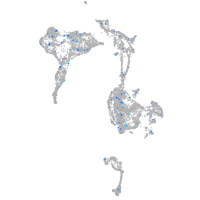
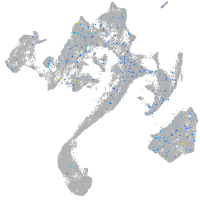
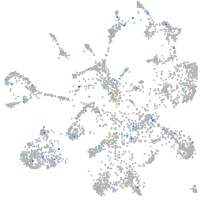
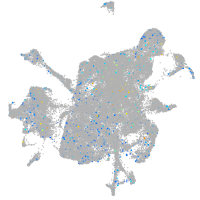
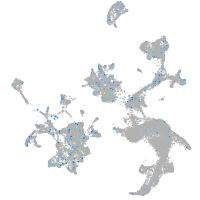
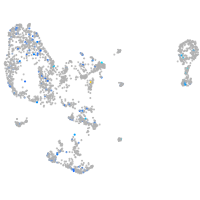
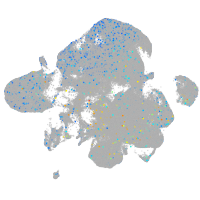
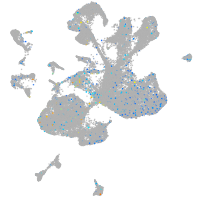
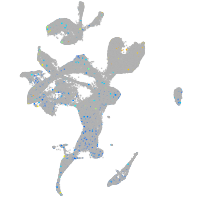
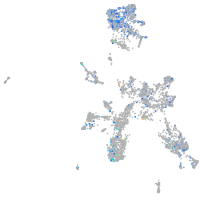
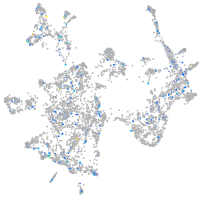
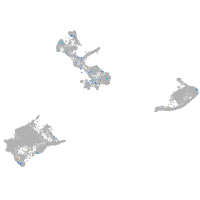
Gene expression UMAP
Display:
Expression
Stage
Other cell groups
all cells
blastomeres
PGCs
endoderm
axial mesoderm
muscle
mural cells /
non-skeletal muscle
mesenchyme
hematopoietic /
vasculature
pronephros
neural
spinal cord / glia
eye
taste / olfactory
otic / lateral line
epidermis
periderm
fin
ionocytes / mucous
pigment cells
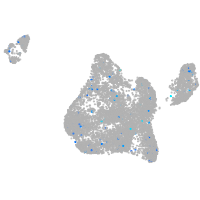
Expression by stage/cluster
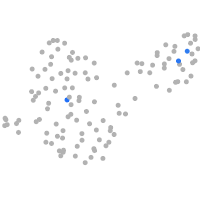
Correlated gene expression
Positive correlation
Negative correlation
Gene
r
Gene
r
BX119963.2
0.237
rps12
-0.048
si:ch211-154e10.1
0.223
rps15
-0.045
LOC101883270
0.215
rplp0
-0.042
LO017718.1
0.213
gpd1b
-0.042
si:dkey-73p2.2
0.208
rpl36a
-0.042
CU928083.1
0.204
gch2
-0.042
CACNA2D3 (1 of many)
0.200
rps21
-0.041
vstm2l
0.184
rpl10
-0.038
slc5a8
0.183
pcbd1
-0.038
si:dkey-175d9.2
0.178
pts
-0.037
gramd1c
0.177
akr1b1
-0.036
gnrh2
0.177
si:dkey-251i10.2
-0.035
si:ch211-197e7.1
0.174
prdx1
-0.035
XLOC-006316
0.173
rps19
-0.035
LOC108190117
0.168
faua
-0.034
CR381544.2
0.155
paics
-0.034
LOC110439948
0.154
cmtm3
-0.034
kcnab2b
0.150
marcksl1b
-0.034
gbe1a
0.147
rps20
-0.033
XLOC-000490
0.144
rpl8
-0.032
TSTA3 (1 of many)
0.140
rpl28
-0.032
mbl2
0.138
tmsb4x
-0.031
LO017816.1
0.138
gstp1
-0.031
si:dkey-1h4.4
0.137
uraha
-0.031
cp
0.136
CABZ01021592.1
-0.029
si:ch73-170d6.2
0.129
prdx5
-0.029
cacna1bb
0.128
hbbe3
-0.029
rph3aa
0.127
C12orf75
-0.029
pik3c2g
0.125
rpl12
-0.029
cx34.4
0.122
rps13
-0.029
XLOC-012926
0.122
rps11
-0.029
znf106b
0.119
iah1
-0.028
ptgis
0.118
actb2
-0.028
cnr1
0.117
rpl11
-0.028
pkhd1l1
0.117
cyt1l
-0.027