Daniocell
elf2a (fin)
E74-like factor 2a (ets domain transcription factor)
ZFIN
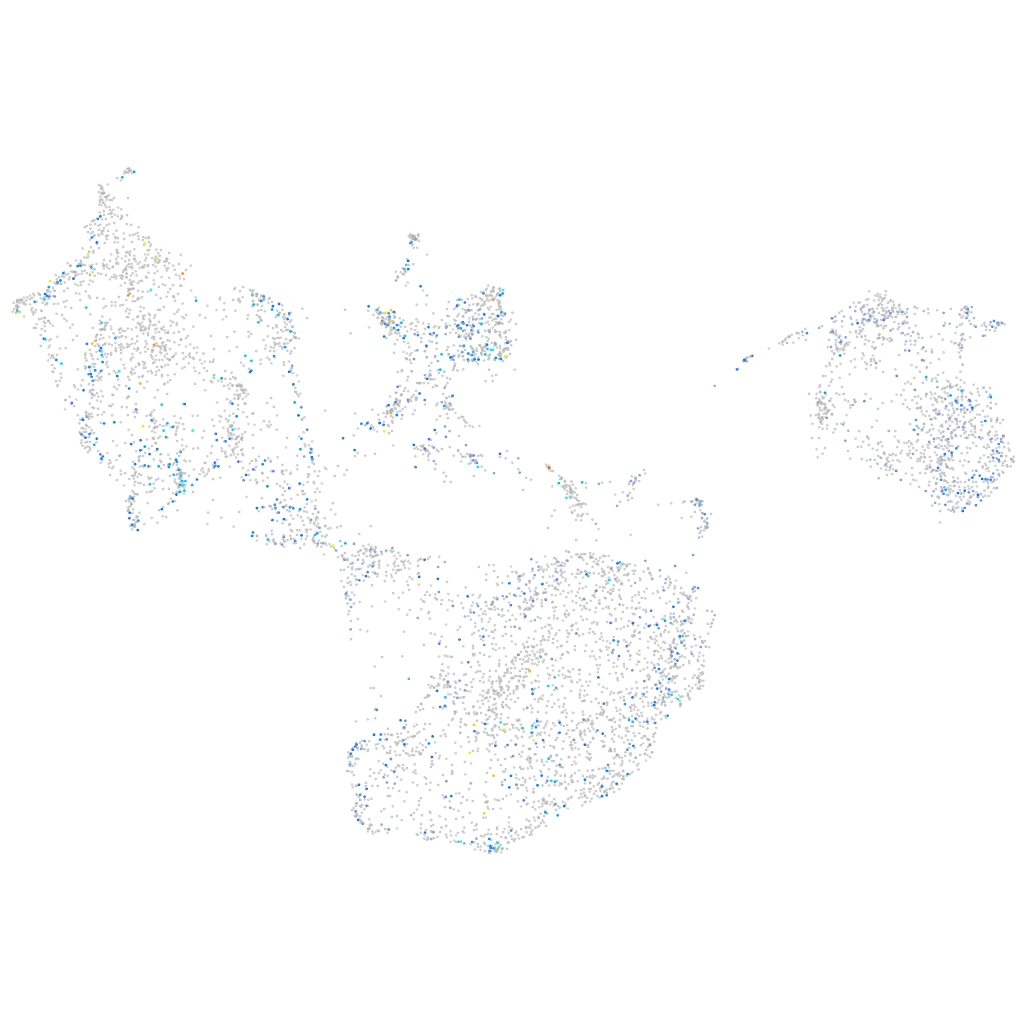
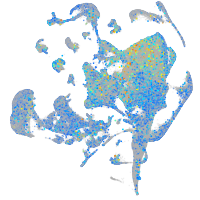
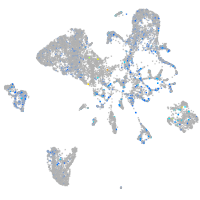
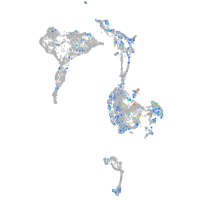
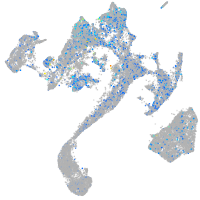
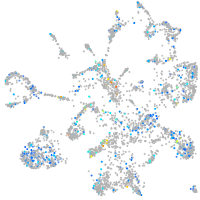
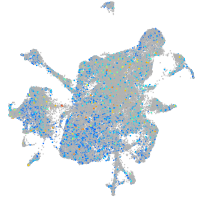
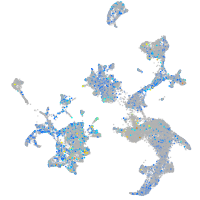
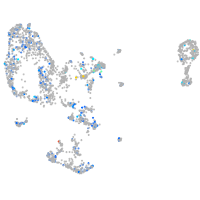
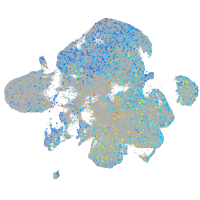
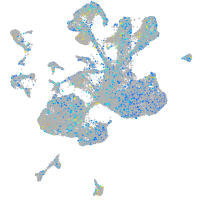
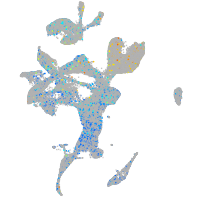
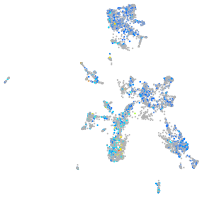
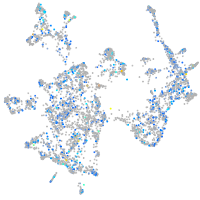
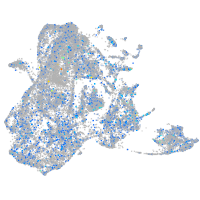
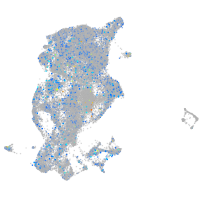
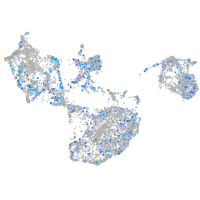
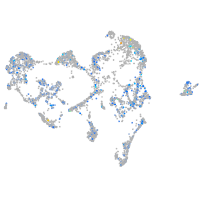
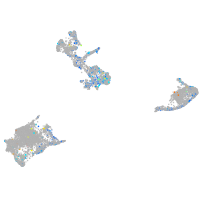
Gene expression UMAP
Display:
Expression
Stage
Other cell groups
all cells
blastomeres
PGCs
endoderm
axial mesoderm
muscle
mural cells /
non-skeletal muscle
mesenchyme
hematopoietic /
vasculature
pronephros
neural
spinal cord / glia
eye
taste / olfactory
otic / lateral line
epidermis
periderm
fin
ionocytes / mucous
pigment cells
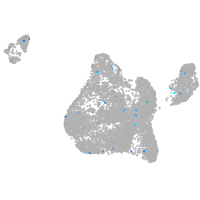
Expression by stage/cluster
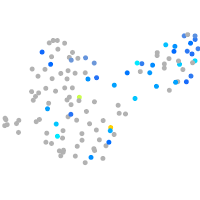
Correlated gene expression
Positive correlation
Negative correlation
Gene
r
Gene
r
CABZ01088864.1
0.116
cyt1l
-0.069
si:ch211-133l5.7
0.109
wu:fb18f06
-0.065
cuedc1a
0.105
rps29
-0.061
si:ch73-44m9.3
0.100
cyt1
-0.057
si:dkeyp-46h3.8
0.099
krt4
-0.054
CR385078.1
0.093
col11a1a
-0.053
hmgb1b
0.092
tmsb1
-0.053
cd82a
0.092
zgc:175088
-0.053
tnni1b
0.089
cfl1l
-0.052
BX927257.1
0.089
tmsb4x
-0.052
RF00096
0.088
krt5
-0.049
marcksl1a
0.087
s100a10b
-0.049
si:ch1073-186o8.3
0.087
krtt1c19e
-0.046
si:ch73-100l22.3
0.085
pfn1
-0.046
six3b
0.085
ecrg4b
-0.046
srrm2
0.085
rpl38
-0.045
yy1a
0.084
cldn1
-0.045
CU571074.1
0.084
and1
-0.044
cirbpb
0.084
zgc:153284
-0.042
psma3
0.083
lgals1l1
-0.041
h2afva
0.083
cotl1
-0.041
BX005417.2
0.083
arhgef5
-0.041
CR631122.1
0.083
si:dkey-16p21.8
-0.041
XLOC-044110
0.082
si:dkey-33c14.3
-0.041
LOC100536469
0.082
rps28
-0.041
CR847887.1
0.082
igfbp2a
-0.041
CR847566.1
0.081
itgb1b.1
-0.040
srsf3b
0.081
aep1
-0.040
panx2
0.081
zgc:92380
-0.040
hnrnpa0a
0.080
krt91
-0.040
max
0.080
icn
-0.040
nabp1a
0.080
icn2
-0.040
nog1
0.080
rbp4
-0.040
CABZ01080702.1
0.080
si:ch211-166a6.5
-0.039
si:ch211-286o17.1
0.080
si:dkey-248g15.3
-0.039