Daniocell
dyrk3 (epidermis)
dual specificity tyrosine phosphorylation regulated kinase 3
ZFIN
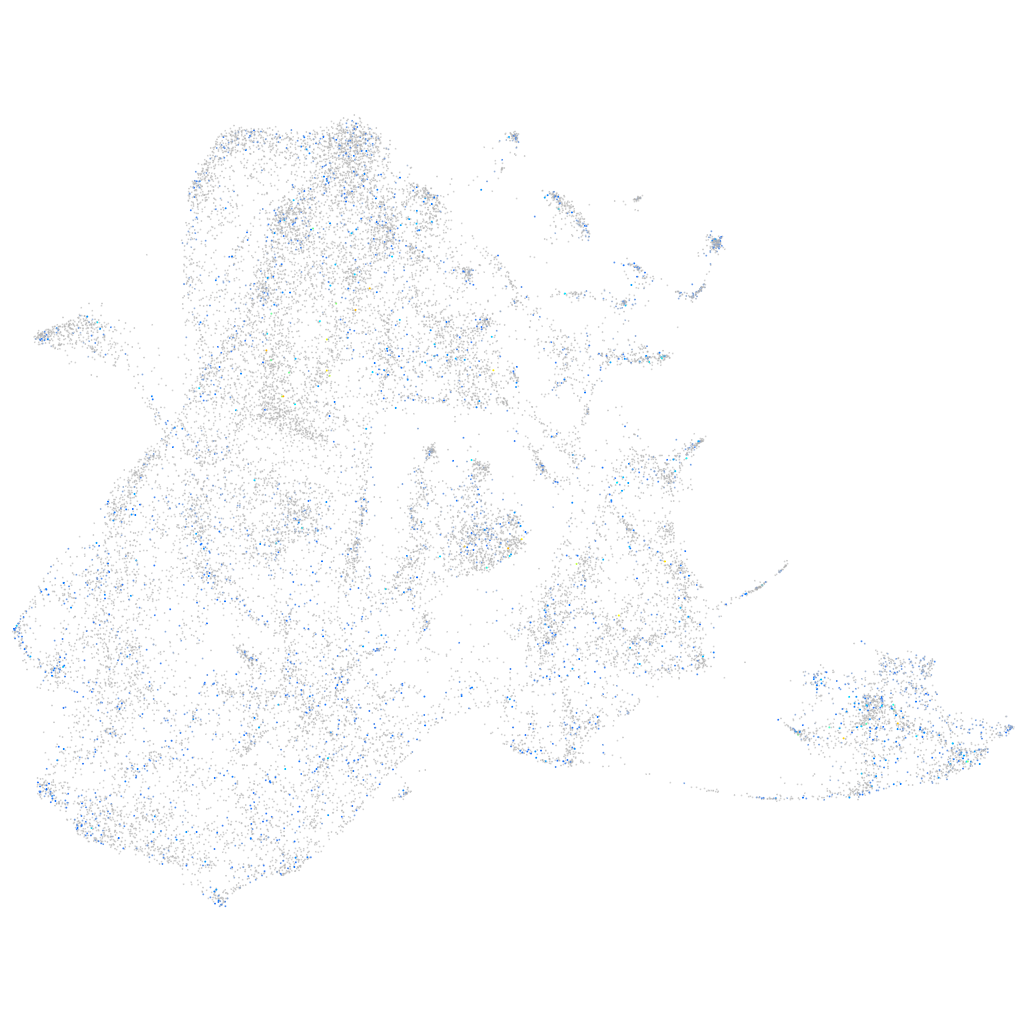
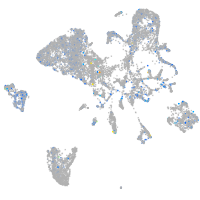
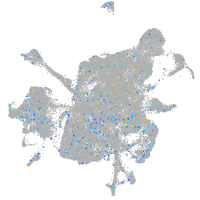
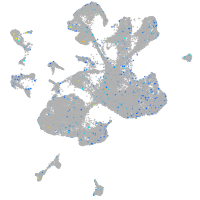
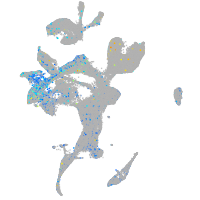
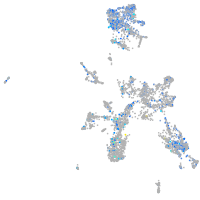
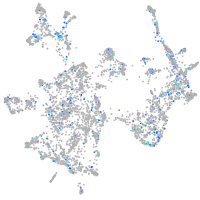
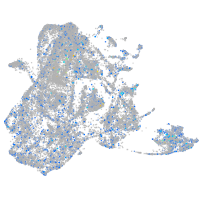
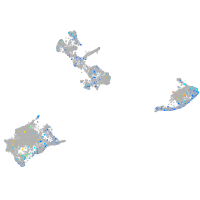
Gene expression UMAP
Display:
Expression
Stage
Other cell groups
all cells
blastomeres
PGCs
endoderm
axial mesoderm
muscle
mural cells /
non-skeletal muscle
mesenchyme
hematopoietic /
vasculature
pronephros
neural
spinal cord / glia
eye
taste / olfactory
otic / lateral line
epidermis
periderm
fin
ionocytes / mucous
pigment cells
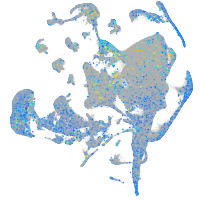
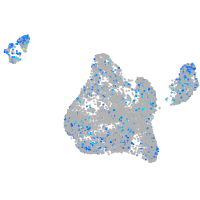
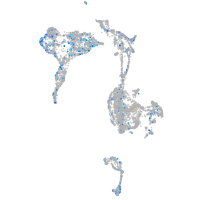
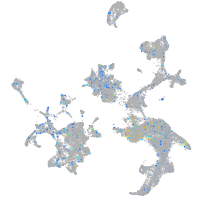
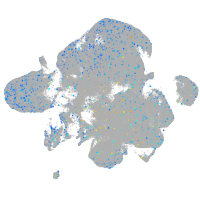
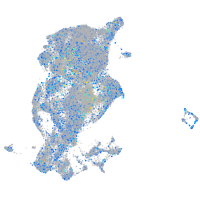
Expression by stage/cluster
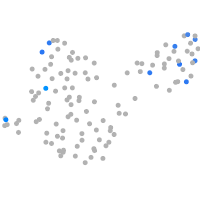
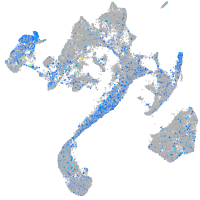
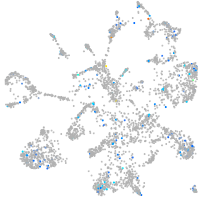
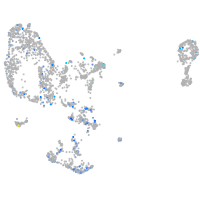
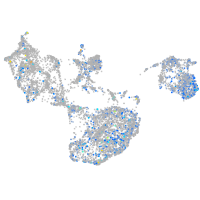
Correlated gene expression
Positive correlation
Negative correlation
Gene
r
Gene
r
si:ch211-276i6.1
0.096
tmsb4x
-0.069
scel
0.087
krt5
-0.046
arap1a
0.086
cotl1
-0.046
evpla
0.086
sparc
-0.045
cldne
0.085
si:ch211-39i22.1
-0.044
si:ch211-157c3.4
0.085
col1a1b
-0.044
evplb
0.083
pfn1
-0.044
anxa1b
0.083
col1a2
-0.043
abca12
0.082
krtt1c19e
-0.041
si:ch73-347e22.8
0.082
aep1
-0.041
zgc:100868
0.082
si:dkey-16p21.8
-0.040
zgc:153665
0.080
rpl37
-0.040
ppl
0.080
zgc:136930
-0.039
spint2
0.080
si:dkey-33c14.3
-0.039
si:ch211-125o16.4
0.079
lgals1l1
-0.039
si:dkey-87o1.2
0.079
krt91
-0.039
si:ch73-204p21.2
0.078
rbp4
-0.039
si:ch211-195b11.3
0.078
ptmaa
-0.038
krt92
0.078
rps29
-0.036
zgc:110333
0.078
cldn1
-0.035
oclnb
0.078
rpl38
-0.035
nqo1
0.078
rpl39
-0.035
mt-cyb
0.078
col1a1a
-0.035
hrc
0.077
aqp3a
-0.034
si:ch211-217k17.9
0.077
rpl29
-0.033
stx11b.1
0.076
si:dkey-183i3.5
-0.033
dhrs13a.2
0.076
ecrg4b
-0.033
zgc:111983
0.076
cxl34b.11
-0.032
flot2b
0.075
col11a1a
-0.032
gbgt1l4
0.074
spaca4l
-0.032
LOC100535170
0.074
stmn1a
-0.031
si:ch73-52f15.5
0.074
rps28
-0.030
paqr5b
0.074
col2a1b
-0.030
si:dkey-217f16.5
0.074
cap1
-0.030
tmem45b
0.074
ptgdsb.1
-0.030