Daniocell
drosha (blastomeres)
drosha ribonuclease III
ZFIN
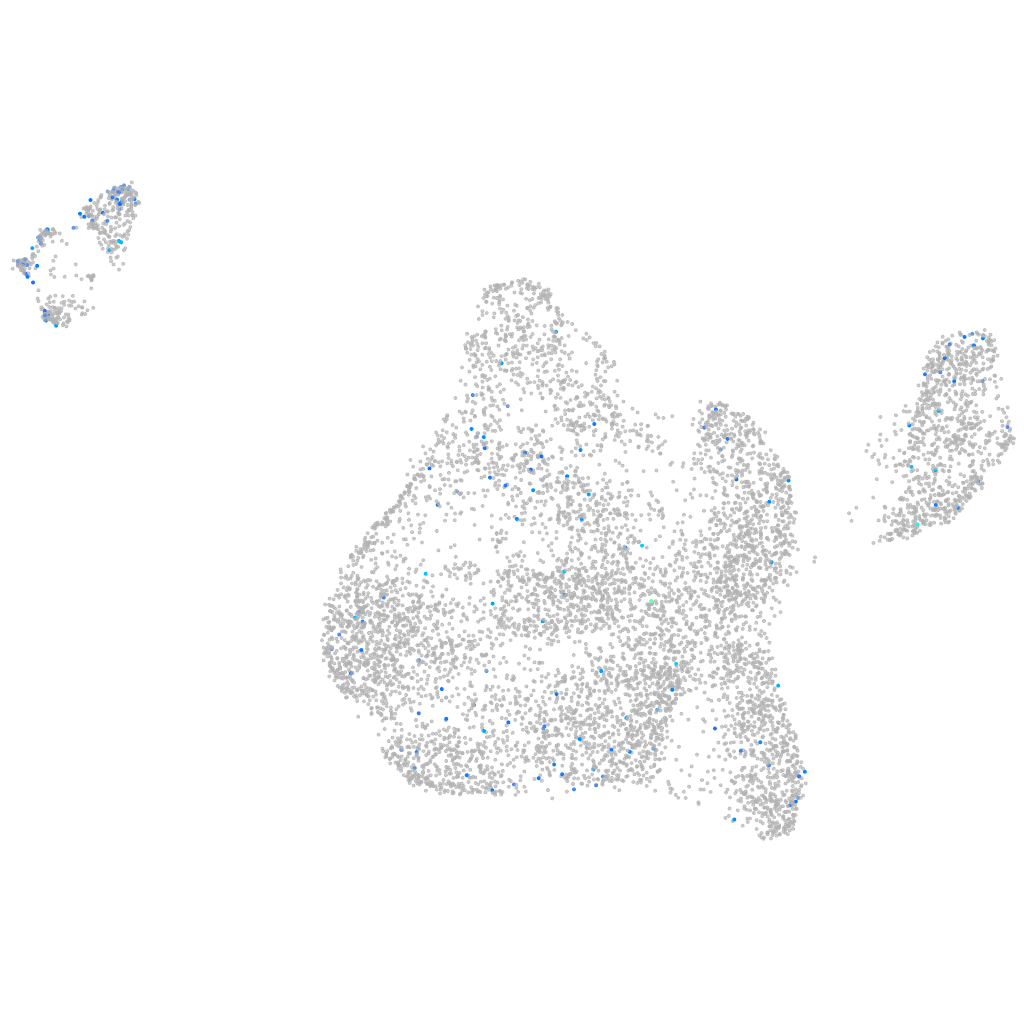
Gene expression UMAP
Display:
Expression
Stage
Other cell groups
all cells
blastomeres
PGCs
endoderm
axial mesoderm
muscle
mural cells /
non-skeletal muscle
mesenchyme
hematopoietic /
vasculature
pronephros
neural
spinal cord / glia
eye
taste / olfactory
otic / lateral line
epidermis
periderm
fin
ionocytes / mucous
pigment cells
Expression by stage/cluster
Correlated gene expression
Positive correlation
Negative correlation
Gene
r
Gene
r
si:ch211-203k16.3
0.136
si:ch73-1a9.3
-0.107
si:dkey-161j23.6
0.125
stm
-0.107
btg4
0.122
si:dkey-151g10.6
-0.100
LOC101883097
0.118
marcksl1b
-0.098
CU929307.1
0.117
hnrnpa0b
-0.090
BX248318.1
0.117
hmgb2a
-0.086
fbln2
0.110
aldob
-0.085
BX470189.2
0.104
hspb1
-0.083
kcnb1
0.104
dynll1
-0.081
fbxo32
0.103
eef1a1l1
-0.081
CR293531.2
0.103
polr3gla
-0.079
maco1a
0.101
si:ch211-152c2.3
-0.079
mid1ip1l
0.100
hmgn6
-0.078
cldng
0.099
hmga1a
-0.077
rap1gap2a
0.099
apoeb
-0.072
si:ch211-147a11.3
0.099
rplp1
-0.070
si:dkeyp-75h12.2
0.098
si:ch211-222l21.1
-0.069
fstl4
0.098
rps6
-0.067
homer3b
0.097
si:ch1073-80i24.3
-0.064
zfr2
0.096
rpl39
-0.064
c16h7orf31
0.096
rpl32
-0.063
slc25a25a
0.096
khdrbs1a
-0.063
rnf128a
0.095
snrpf
-0.062
dpys
0.095
rpl26
-0.061
zgc:162879
0.095
rpl7a
-0.061
pik3r3b
0.095
rpl27
-0.060
LOC103909796
0.094
lrwd1
-0.059
si:dkey-11e23.9
0.094
si:dkey-56m19.5
-0.059
myd88
0.094
rps20
-0.058
CR931763.1
0.094
rps15a
-0.058
bmp15
0.093
cirbpb
-0.058
LOC108191717
0.093
rplp0
-0.058
tob1a
0.091
CR383676.1
-0.057
zgc:56231
0.091
rps12
-0.057
yipf1
0.091
hmgb2b
-0.056