Daniocell
dock4b (muscle)
dedicator of cytokinesis 4b
ZFIN
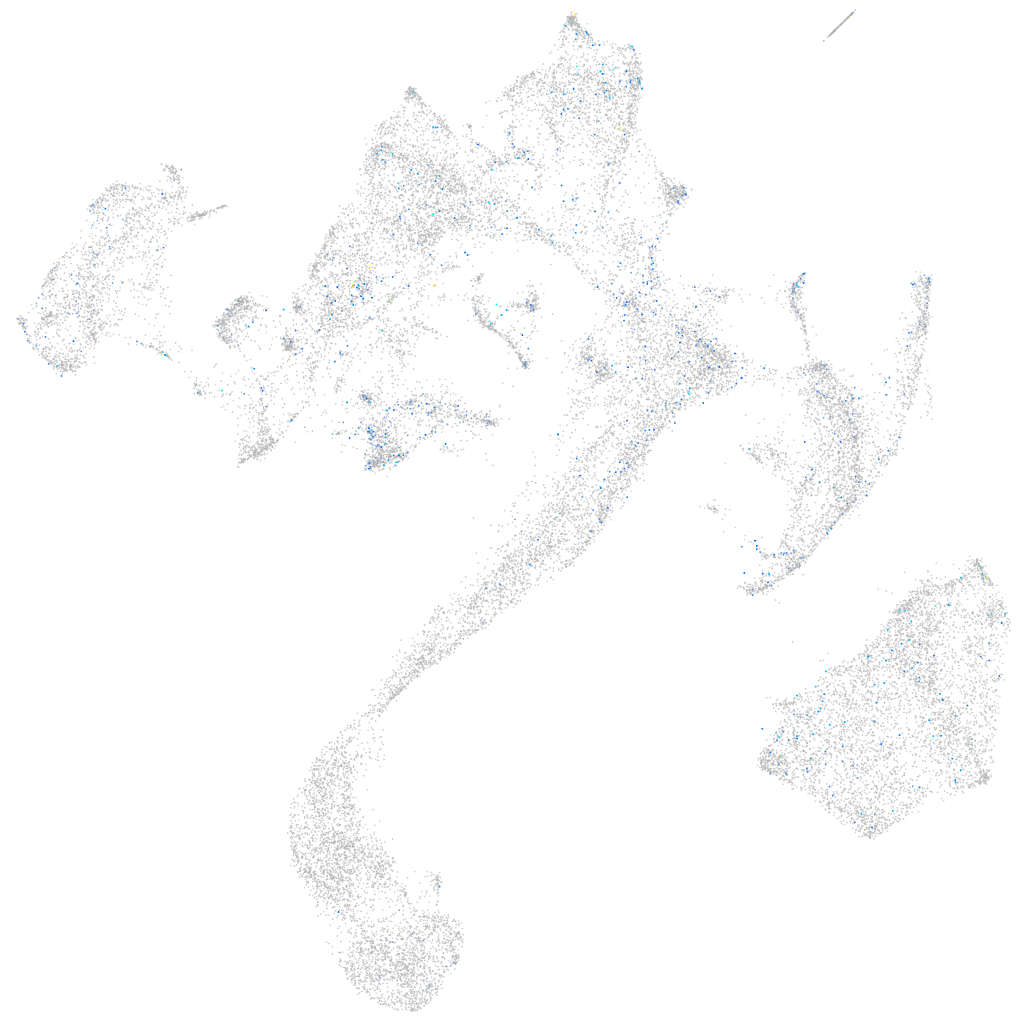
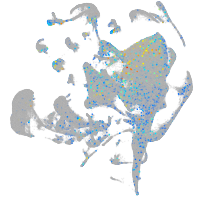
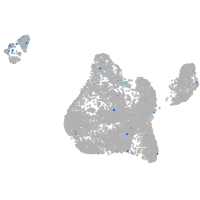
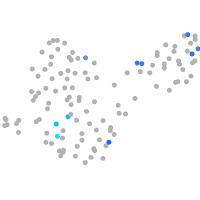
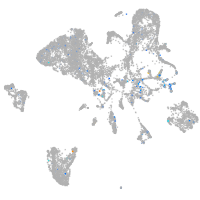
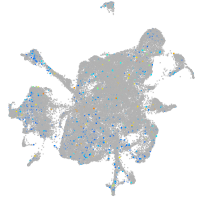
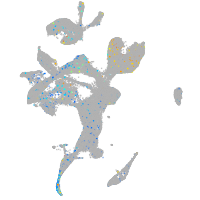
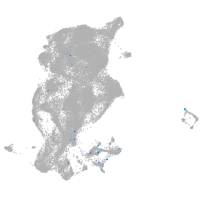
Gene expression UMAP
Display:
Expression
Stage
Other cell groups
all cells
blastomeres
PGCs
endoderm
axial mesoderm
muscle
mural cells /
non-skeletal muscle
mesenchyme
hematopoietic /
vasculature
pronephros
neural
spinal cord / glia
eye
taste / olfactory
otic / lateral line
epidermis
periderm
fin
ionocytes / mucous
pigment cells
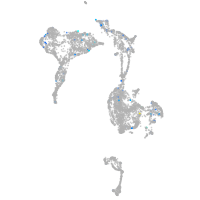
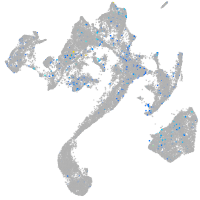
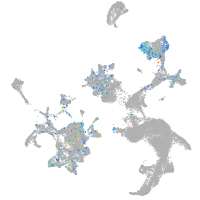
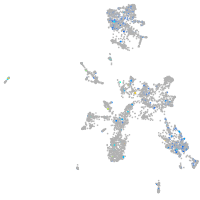
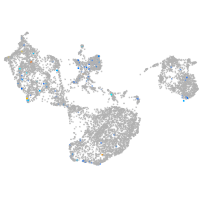
Expression by stage/cluster
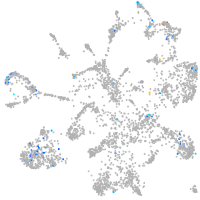
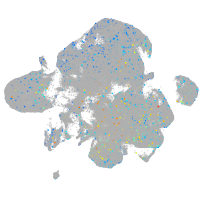
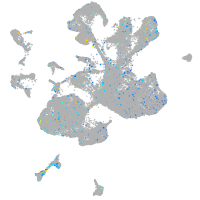
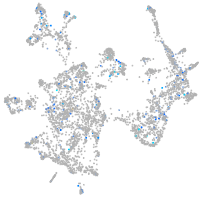
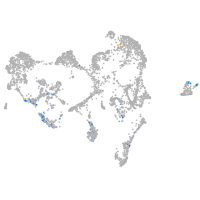
Correlated gene expression
Positive correlation
Negative correlation
Gene
r
Gene
r
LOC110439594
0.085
tpma
-0.053
si:ch211-196h24.2
0.083
myl1
-0.053
zpld1a
0.081
mylpfa
-0.052
si:ch211-255g12.6
0.080
acta1b
-0.052
slc4a5a
0.075
mylz3
-0.051
LOC110439452
0.070
tnnc2
-0.051
si:rp71-1i20.2
0.068
mybphb
-0.050
pde4bb
0.067
mylpfb
-0.050
si:dkey-103k4.1
0.063
tnnt3a
-0.049
LOC110438192
0.061
myhz1.3
-0.049
BX571724.2
0.060
ak1
-0.048
si:dkey-205i10.2
0.059
hhatla
-0.047
LOC110439795.1
0.059
tnni2a.4
-0.047
LOC101884392
0.058
myoz1b
-0.046
gba3
0.058
ryr1b
-0.046
cfl1
0.056
myom2a
-0.046
ftr01
0.056
aldoab
-0.045
LOC100148951
0.056
si:ch73-367p23.2
-0.045
c8b
0.055
actc1b
-0.045
si:ch211-132p1.3
0.055
ryr3
-0.044
si:dkey-1j5.4
0.055
actn3a
-0.043
sox11a
0.055
ckmb
-0.043
si:ch211-271d10.2
0.054
pvalb2
-0.043
si:dkey-26i13.3
0.054
casq1a
-0.043
ccdc149a
0.054
prr33
-0.043
ndrg4
0.053
atp2a1
-0.043
LOC101884740
0.053
actn3b
-0.043
slc2a11a
0.052
CABZ01078594.1
-0.043
dscaml1
0.052
slc25a4
-0.043
tnfrsf21
0.052
ckma
-0.043
dlx6a
0.052
srl
-0.041
ptmaa
0.052
myom1a
-0.041
LOC101884122
0.051
CABZ01061524.1
-0.041
gpm6aa
0.050
rtn2a
-0.041
LOC101885363
0.050
pvalb1
-0.041