Daniocell
dip2ca (periderm)
disco-interacting protein 2 homolog Ca
ZFIN
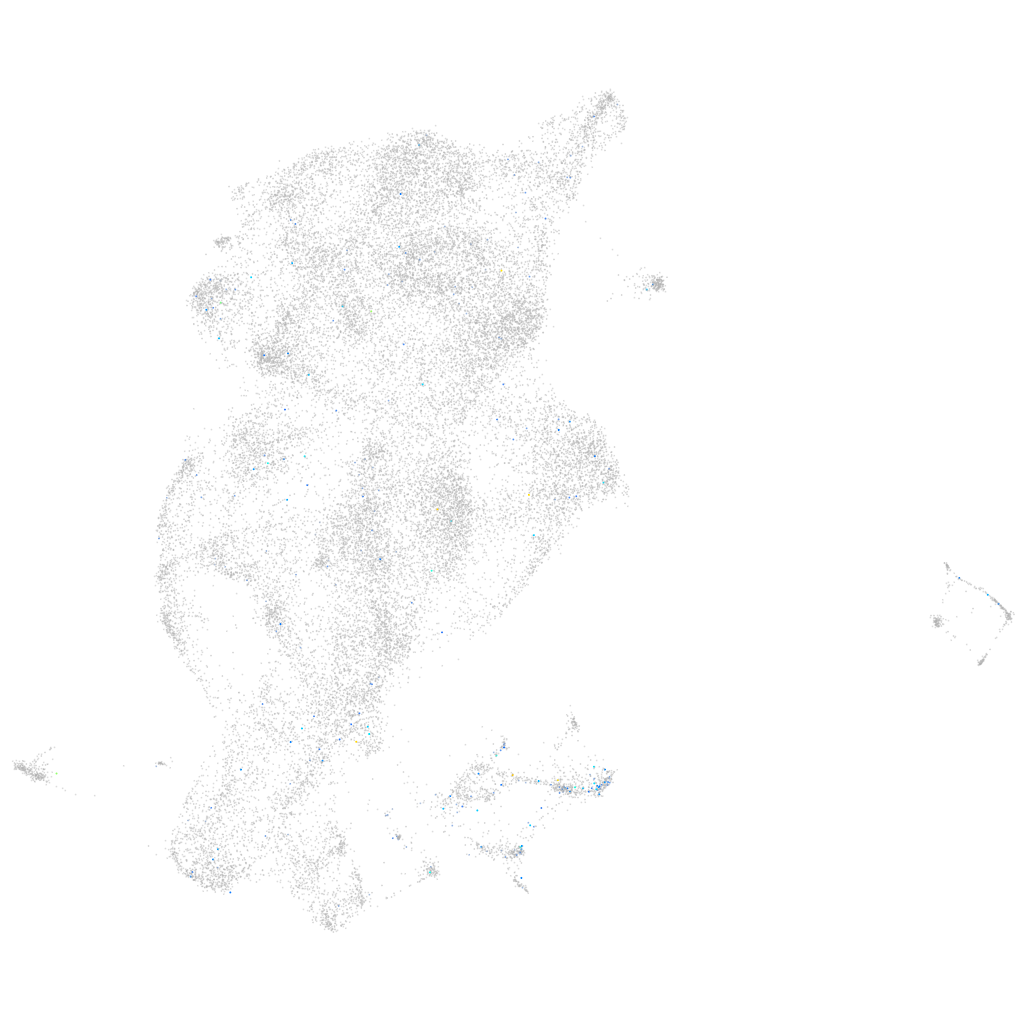
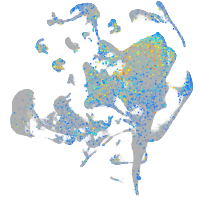
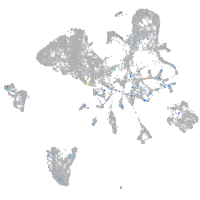
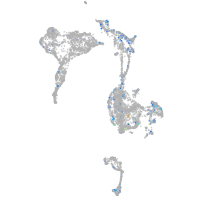
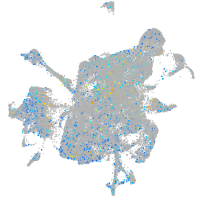
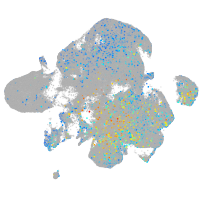
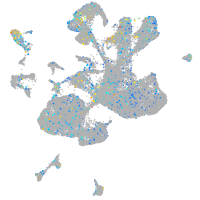
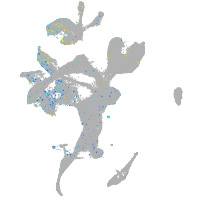
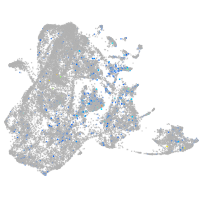
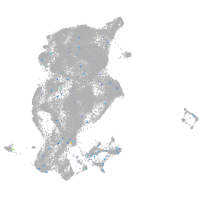
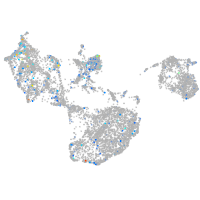
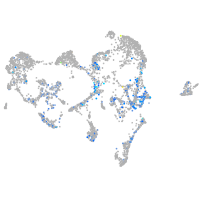
Gene expression UMAP
Display:
Expression
Stage
Other cell groups
all cells
blastomeres
PGCs
endoderm
axial mesoderm
muscle
mural cells /
non-skeletal muscle
mesenchyme
hematopoietic /
vasculature
pronephros
neural
spinal cord / glia
eye
taste / olfactory
otic / lateral line
epidermis
periderm
fin
ionocytes / mucous
pigment cells
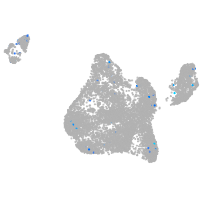
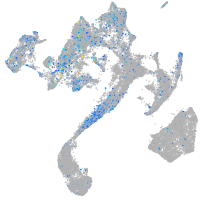
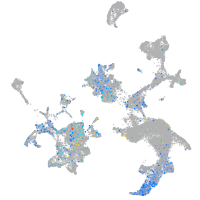
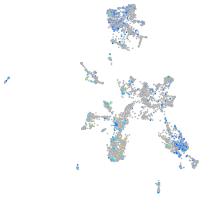
Expression by stage/cluster
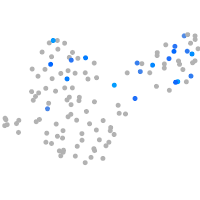
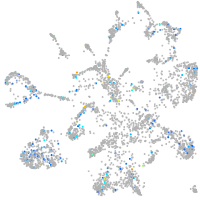
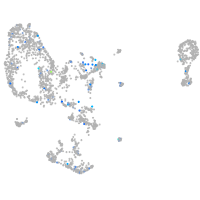
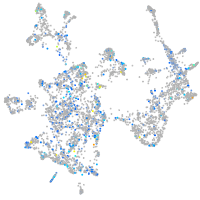
Correlated gene expression
Positive correlation
Negative correlation
Gene
r
Gene
r
itga8
0.192
cyt1
-0.047
sema6ba
0.167
krt4
-0.038
LOC101884281
0.158
gsta.1
-0.038
BX545856.1
0.154
zgc:175088
-0.036
LOC101886390
0.140
krt5
-0.035
XLOC-023304
0.138
cyt1l
-0.033
BX569779.1
0.133
si:ch211-195b11.3
-0.032
mir459
0.131
cfl1l
-0.031
XLOC-005983
0.125
wu:fb18f06
-0.031
znf985
0.123
krt17
-0.030
LOC103911742
0.121
zgc:193505
-0.030
cnih2
0.121
nqo1
-0.030
LOC110438269
0.120
agr1
-0.029
LOC108180010
0.115
mgst1.2
-0.029
LOC103910566
0.108
ckap4
-0.028
cngk
0.108
s100w
-0.028
zgc:153681
0.108
si:dkey-184p9.7
-0.025
LOC108191611
0.107
CR854839.1
-0.024
kcnj10a
0.107
capns1a
-0.024
CR385050.3
0.105
tdh
-0.024
DISP3
0.103
rnf183
-0.023
CABZ01077220.2
0.103
si:ch211-217k17.9
-0.023
XLOC-023752
0.102
mgst2
-0.023
erbb4a
0.100
fuca1.1
-0.023
ncam1a
0.099
icn2
-0.023
kirrel1b
0.099
pycard
-0.023
LOC110437817
0.098
si:ch73-52f15.5
-0.023
cspg5a
0.097
s100a10b
-0.022
XLOC-043092
0.097
sh3gl1a
-0.022
oprm1
0.097
cst14b.1
-0.022
CR855311.5
0.097
zgc:113054
-0.022
unc13c
0.096
mgst3b
-0.022
tuba1a
0.096
eef1da
-0.021
urp1
0.095
anxa1a
-0.021
nectin1b
0.095
rpl31
-0.021