Daniocell
dgcr2 (pronephros)
DiGeorge syndrome critical region gene 2
ZFIN
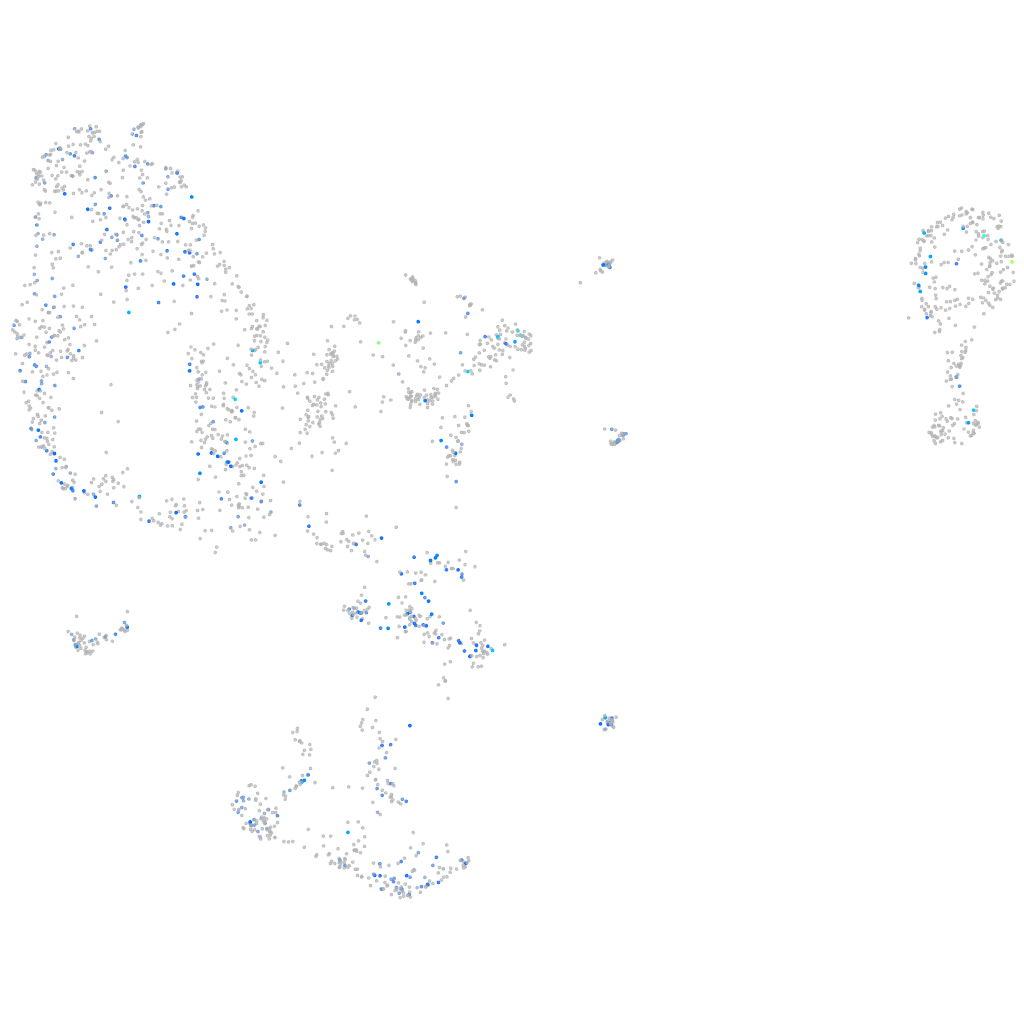
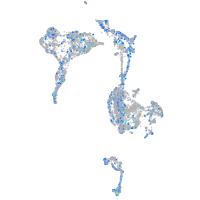
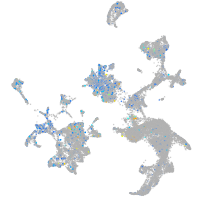
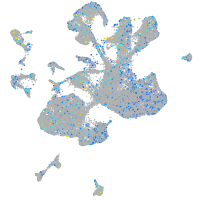
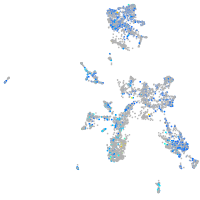
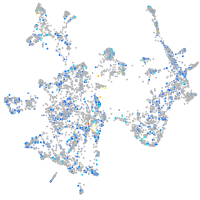
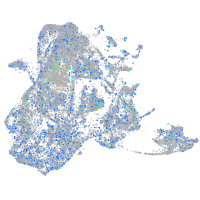
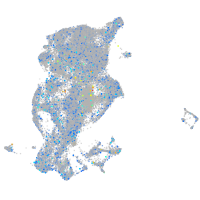
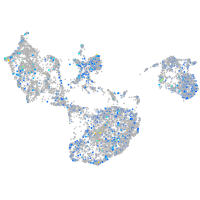
Gene expression UMAP
Display:
Expression
Stage
Other cell groups
all cells
blastomeres
PGCs
endoderm
axial mesoderm
muscle
mural cells /
non-skeletal muscle
mesenchyme
hematopoietic /
vasculature
pronephros
neural
spinal cord / glia
eye
taste / olfactory
otic / lateral line
epidermis
periderm
fin
ionocytes / mucous
pigment cells
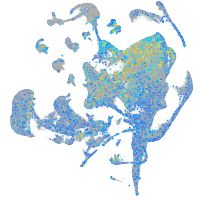
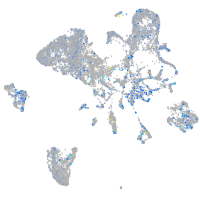
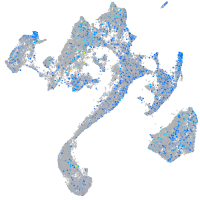
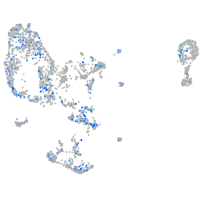
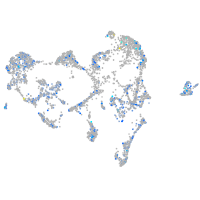
Expression by stage/cluster
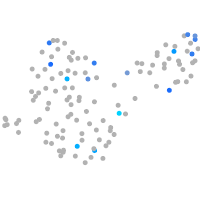
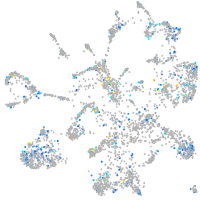
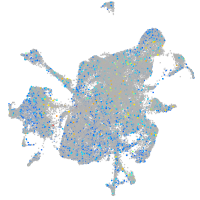
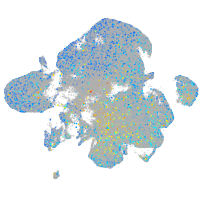
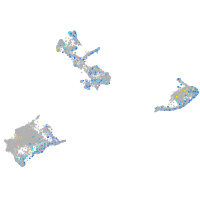
Correlated gene expression
Positive correlation
Negative correlation
Gene
r
Gene
r
hist1h2ba
0.169
cxcl12b
-0.064
CABZ01088229.1
0.165
plp2
-0.064
LOC101884106
0.163
osr1
-0.063
FQ377628.1
0.158
si:dkey-66i24.9
-0.063
CABZ01067754.1
0.156
si:dkey-151g10.6
-0.062
si:ch211-180f4.1
0.153
ddx18
-0.060
si:dkey-22o12.2
0.153
rpl29
-0.060
slc27a1b
0.149
ing5b
-0.059
neurod6a
0.145
ddx51
-0.057
malrd1
0.144
gngt2b
-0.056
LOC101882015
0.143
ddx24
-0.056
ugt5c2
0.143
rrp15
-0.055
calhm2
0.143
si:ch211-217k17.7
-0.054
dlgap4b
0.141
LOC103909972
-0.053
si:ch211-253b8.5
0.140
trmt6
-0.053
zgc:77058
0.139
tmem178b
-0.052
si:ch211-215p11.1
0.138
rps12
-0.052
gnb5a
0.138
arglu1a
-0.051
si:dkeyp-34c12.1
0.138
pik3r3b
-0.051
id2a
0.137
scamp5a
-0.050
bub1
0.134
dkc1
-0.050
CU571336.1
0.133
si:ch73-299h12.3
-0.049
mylk2
0.133
tal1
-0.049
dapp1
0.133
ISCU
-0.049
tbx21
0.132
si:ch211-214j24.9
-0.049
tbr1b
0.131
hhex
-0.049
cavin4b
0.131
lig1
-0.049
AL645792.2
0.131
mybbp1a
-0.047
adgrb3
0.129
rps18
-0.047
elfn1b
0.129
fam171b
-0.047
pcdh1g22
0.129
nom1
-0.047
si:ch211-232b12.5
0.128
l3mbtl2
-0.047
zgc:165555.2
0.127
rad51
-0.046
tp53i11a
0.127
COLGALT1
-0.046
BX088587.1
0.126
cplx2l
-0.045