Daniocell
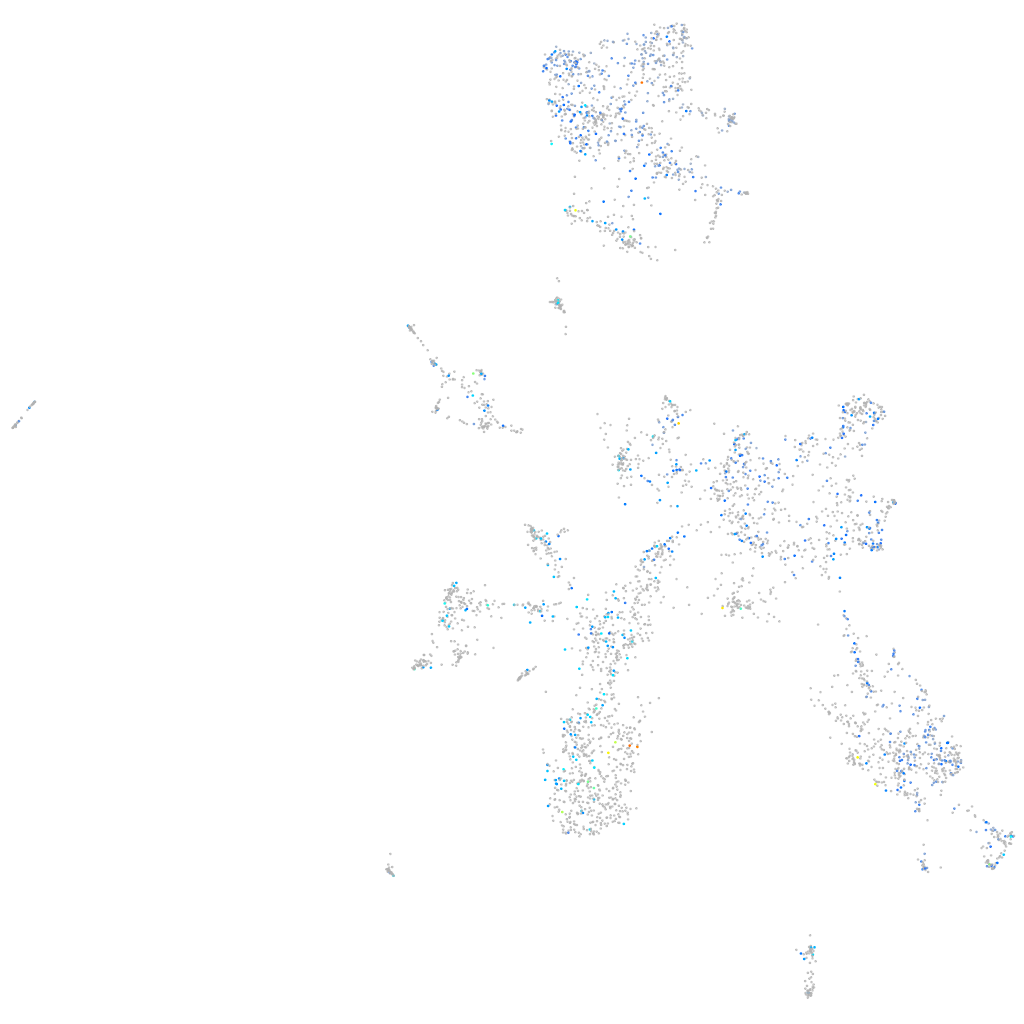
dedd (taste / olfactory)
death effector domain containing
ZFIN
Gene expression UMAP
Display:
Expression
Stage
Other cell groups
all cells
blastomeres
PGCs
endoderm
axial mesoderm
muscle
mural cells /
non-skeletal muscle
mesenchyme
hematopoietic /
vasculature
pronephros
neural
spinal cord / glia
eye
taste / olfactory
otic / lateral line
epidermis
periderm
fin
ionocytes / mucous
pigment cells
Expression by stage/cluster
Correlated gene expression
Positive correlation
Negative correlation
Gene
r
Gene
r
znf972
0.127
tnnt3b
-0.056
commd10
0.113
vegfaa
-0.046
il12a
0.109
LOC108181449
-0.046
antxr1b
0.104
rps28
-0.045
LOC110440093
0.102
tcnba
-0.043
BX323889.1
0.100
si:dkey-188i13.11
-0.042
prf1.1
0.098
nme2b.2
-0.042
LOC110440075
0.096
sc:d0202
-0.042
si:dkey-27d5.3
0.096
tshz2
-0.041
si:dkey-21a6.5
0.095
PLBD2
-0.041
zgc:77398
0.095
rps29
-0.041
si:ch211-223k15.1
0.095
rpl29
-0.041
si:dkey-243k1.3
0.094
elmod3
-0.040
si:dkey-33m11.8
0.093
si:ch73-278m9.1
-0.038
tuba8l3
0.091
nt5c1ab
-0.038
tmem82
0.090
zgc:111983
-0.038
hnrnpa0l
0.090
FO704772.2
-0.037
si:ch211-223g7.6
0.088
si:ch211-113e8.9
-0.037
si:dkeyp-4f2.6
0.088
CR847994.1
-0.037
BX294110.1
0.088
akr7a3
-0.036
si:dkey-22f5.9
0.087
clk4a
-0.036
tnfaip2b
0.086
XLOC-025565
-0.035
LOC108183801
0.086
apoa2
-0.035
si:ch211-8c17.3
0.085
atrnl1b
-0.035
NPFFR2
0.084
mfn2
-0.035
LOC101885479.1
0.084
opn1sw1
-0.034
bnip1b
0.084
rpl37
-0.034
MFN1
0.083
gpatch3
-0.034
dio3b
0.082
TBC1D8B
-0.034
XLOC-011121
0.081
col9a1b
-0.034
marcksl1b
0.081
polr3k
-0.034
LOC569097
0.081
ccdc180
-0.034
taf12
0.080
nedd8l
-0.034
BX957297.1
0.080
sult2st1
-0.034
CR381647.1
0.079
traf1
-0.033