Daniocell
ddb1 (pronephros)
damage-specific DNA binding protein 1
ZFIN
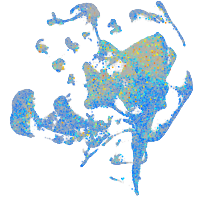
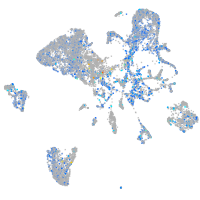
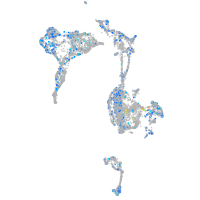
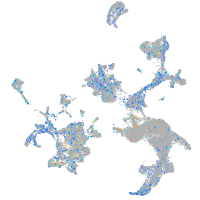
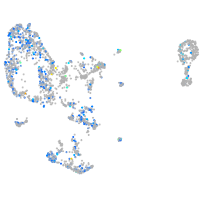
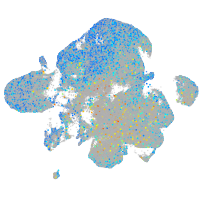
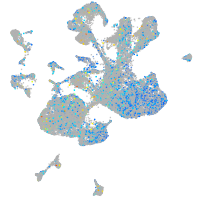
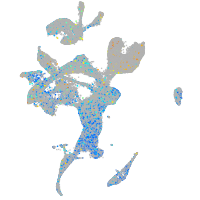
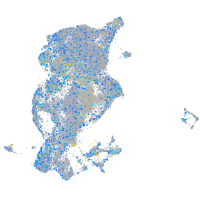
Gene expression UMAP
Display:
Expression
Stage
Other cell groups
all cells
blastomeres
PGCs
endoderm
axial mesoderm
muscle
mural cells /
non-skeletal muscle
mesenchyme
hematopoietic /
vasculature
pronephros
neural
spinal cord / glia
eye
taste / olfactory
otic / lateral line
epidermis
periderm
fin
ionocytes / mucous
pigment cells
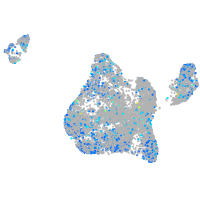
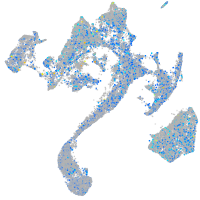
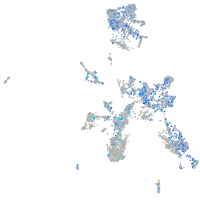
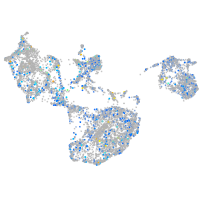
Expression by stage/cluster
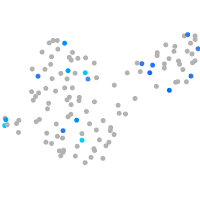
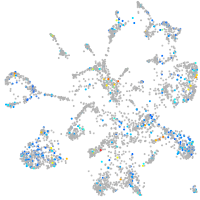
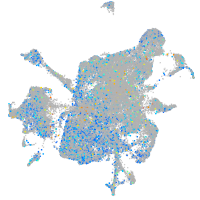
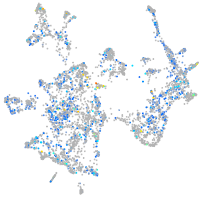
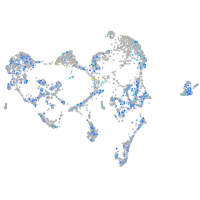
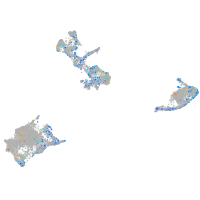
Correlated gene expression
Positive correlation
Negative correlation
Gene
r
Gene
r
unc5a
0.193
rps12
-0.069
tmem121aa
0.191
eloa
-0.067
sema4gb
0.187
wu:fb97g03
-0.064
AL929229.1
0.177
cldng
-0.062
cntn5
0.175
cdh11
-0.059
phtf2
0.164
rpl39
-0.059
CACNA2D1
0.159
hbbe1.1
-0.058
AL935186.6
0.158
ebna1bp2
-0.057
tlx3b
0.154
apoc1
-0.057
BX601648.2
0.153
CABZ01080702.1
-0.057
LOC101883768
0.153
icn
-0.056
rxrab
0.147
BX284638.1
-0.056
cntn1b
0.144
tpt1
-0.055
mrpl46
0.142
zeb2a
-0.054
map3k12
0.138
nono
-0.054
agap2
0.138
si:ch211-137a8.4
-0.054
si:dkey-28e7.3
0.136
pold3
-0.053
gpr52
0.134
cx43.4
-0.053
b3galt1b
0.133
apoeb
-0.053
LOC110440049
0.131
nom1
-0.053
slc18a3a
0.129
si:dkey-66i24.9
-0.053
cpne7
0.128
akap12b
-0.053
si:dkey-7j14.5
0.123
hspb1
-0.053
cntn4
0.123
marcksl1b
-0.052
disp2
0.122
tal1
-0.052
CT025912.1
0.122
si:ch211-106e7.2
-0.052
phf19
0.121
arf1
-0.052
si:ch1073-429i10.3
0.121
znfl2a
-0.052
znf1105
0.121
si:ch73-299h12.2
-0.052
pkma
0.121
myl13
-0.052
cacng4a
0.121
dhx16
-0.052
si:dkey-246e1.3
0.121
cxcl12a
-0.052
FQ790211.1
0.120
hbbe3
-0.051
LOC101883948
0.120
gfi1aa
-0.051
zmp:0000001020
0.119
tpma
-0.050