Daniocell
cyp3c3 (periderm)
"cytochrome P450, family 3, subfamily c, polypeptide 3"
ZFIN
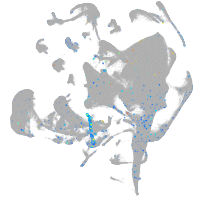
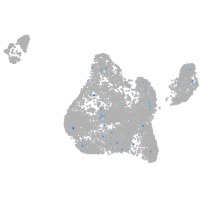
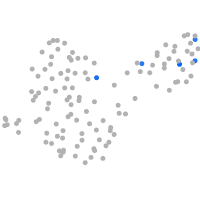
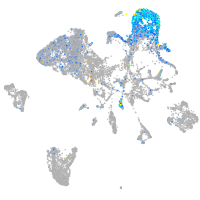
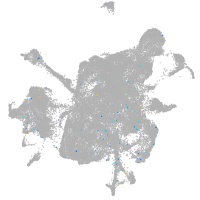
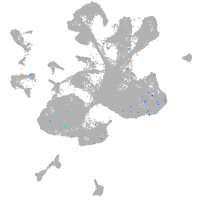
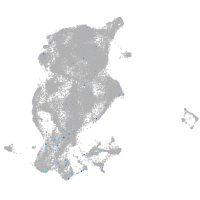
Gene expression UMAP
Display:
Expression
Stage
Other cell groups
all cells
blastomeres
PGCs
endoderm
axial mesoderm
muscle
mural cells /
non-skeletal muscle
mesenchyme
hematopoietic /
vasculature
pronephros
neural
spinal cord / glia
eye
taste / olfactory
otic / lateral line
epidermis
periderm
fin
ionocytes / mucous
pigment cells
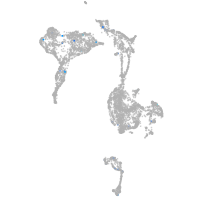
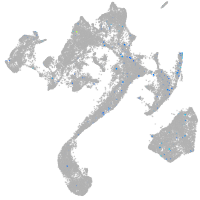
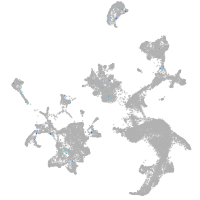
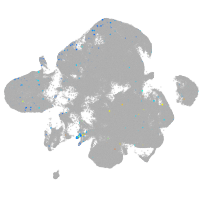
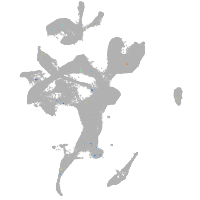
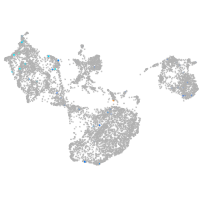
Expression by stage/cluster
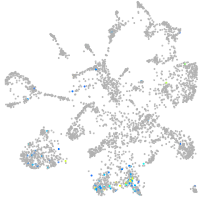
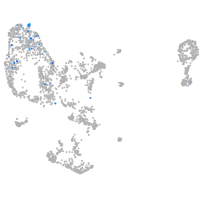
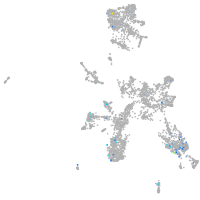
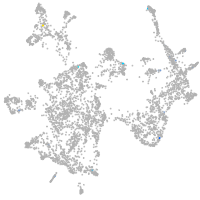
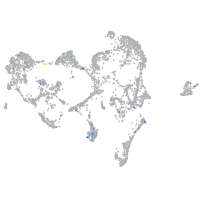
Correlated gene expression
Positive correlation
Negative correlation
Gene
r
Gene
r
BX323064.2
0.210
tcnbb
-0.023
LOC101882303
0.158
eef1da
-0.022
znf1144
0.143
rpl18a
-0.021
taar14a
0.136
si:dkey-16p21.8
-0.020
CR354549.8
0.119
ip6k2a
-0.020
pimr67
0.104
nbr1a
-0.019
sh3gl3b
0.102
krtt1c19e
-0.018
LOC101883563
0.101
si:ch211-207n23.2
-0.018
CT573247.1
0.098
cfl1l
-0.017
SYDE1
0.097
b2ml
-0.017
FP236157.3
0.096
nupr1a
-0.017
ptger1a
0.088
eif2s3
-0.016
LOC103910514
0.086
rplp2
-0.016
tnnt1
0.086
papola
-0.016
terb1
0.085
map1lc3a
-0.015
XLOC-026228
0.080
rpl26
-0.015
si:dkey-78o7.3
0.075
romo1
-0.015
si:dkey-22h13.5
0.075
selenow2b
-0.015
LOC103909664
0.075
rps26l
-0.015
fabp1b.2
0.074
rpl32
-0.015
abhd8a
0.072
si:ch211-212k18.7
-0.015
cbln18
0.072
aldob
-0.014
acot9.2
0.072
mpp1
-0.014
cyp2k17
0.072
ddx21
-0.014
gys1
0.071
dap1b
-0.014
mespba
0.071
tefa
-0.014
il13
0.069
tlcd1
-0.014
BX908386.3
0.069
rpl35
-0.014
klhl36
0.068
chmp5b
-0.014
si:dkey-276j7.3
0.067
si:ch211-195b11.3
-0.013
LOC110438797
0.067
gcshb
-0.013
slc26a6l
0.066
asb8
-0.013
BX649556.2
0.065
si:dkey-33i11.9
-0.013
XLOC-025278
0.064
rpl24
-0.013
CU207269.1
0.063
zgc:163030
-0.013