Daniocell
ctu2 (otic / lateral line)
cytosolic thiouridylase subunit 2 homolog (S. pombe)
ZFIN
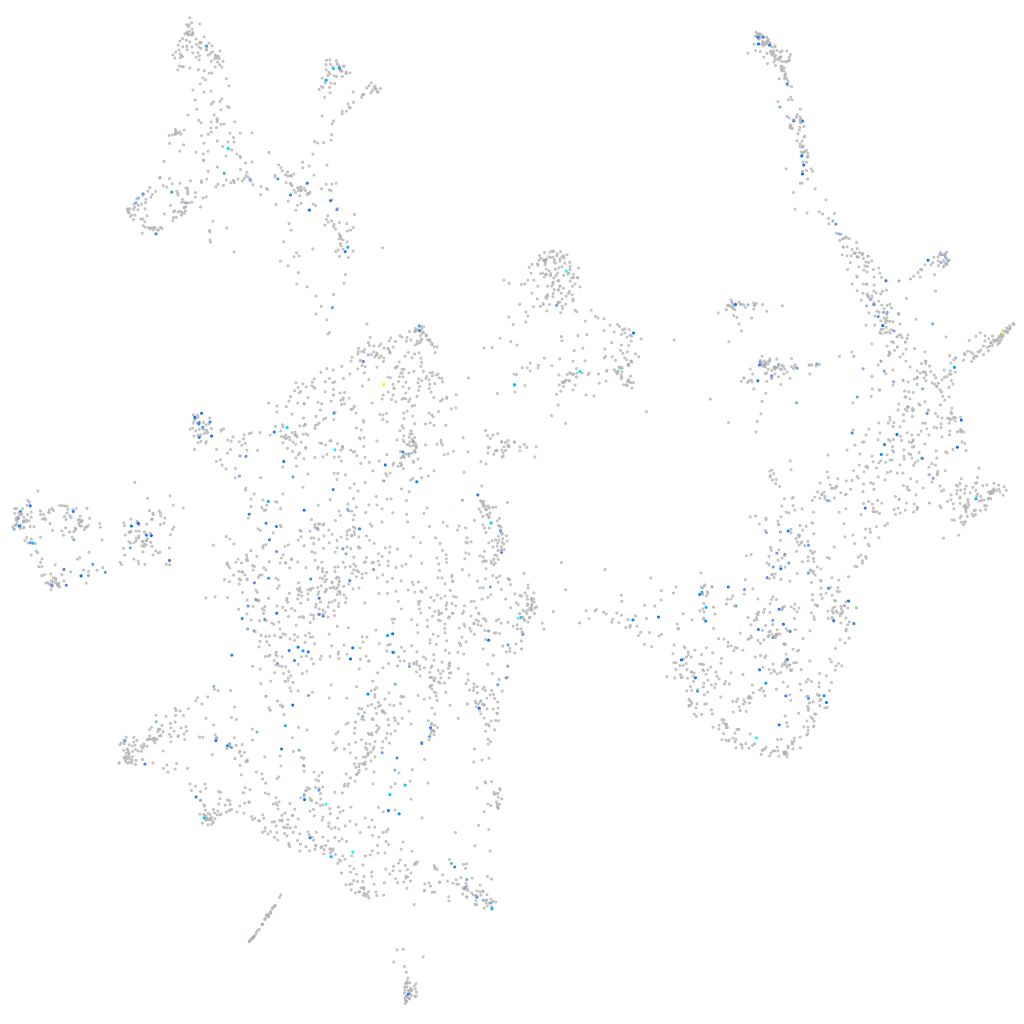
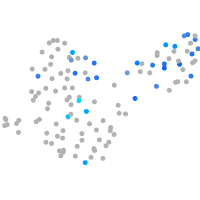
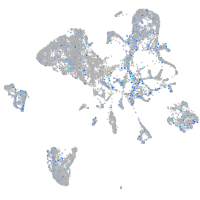
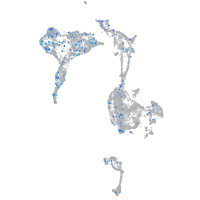
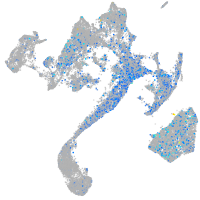
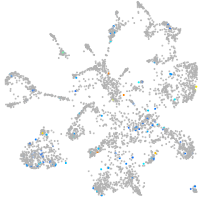
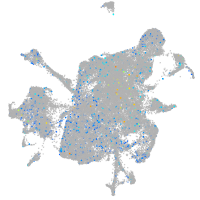
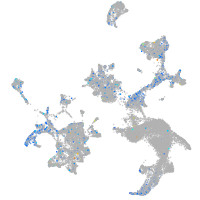
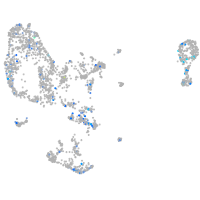
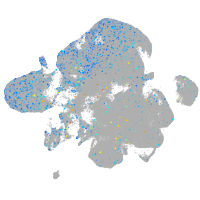
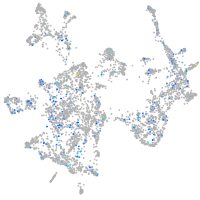
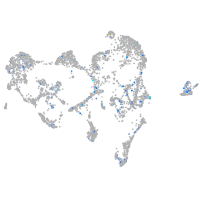
Gene expression UMAP
Display:
Expression
Stage
Other cell groups
all cells
blastomeres
PGCs
endoderm
axial mesoderm
muscle
mural cells /
non-skeletal muscle
mesenchyme
hematopoietic /
vasculature
pronephros
neural
spinal cord / glia
eye
taste / olfactory
otic / lateral line
epidermis
periderm
fin
ionocytes / mucous
pigment cells
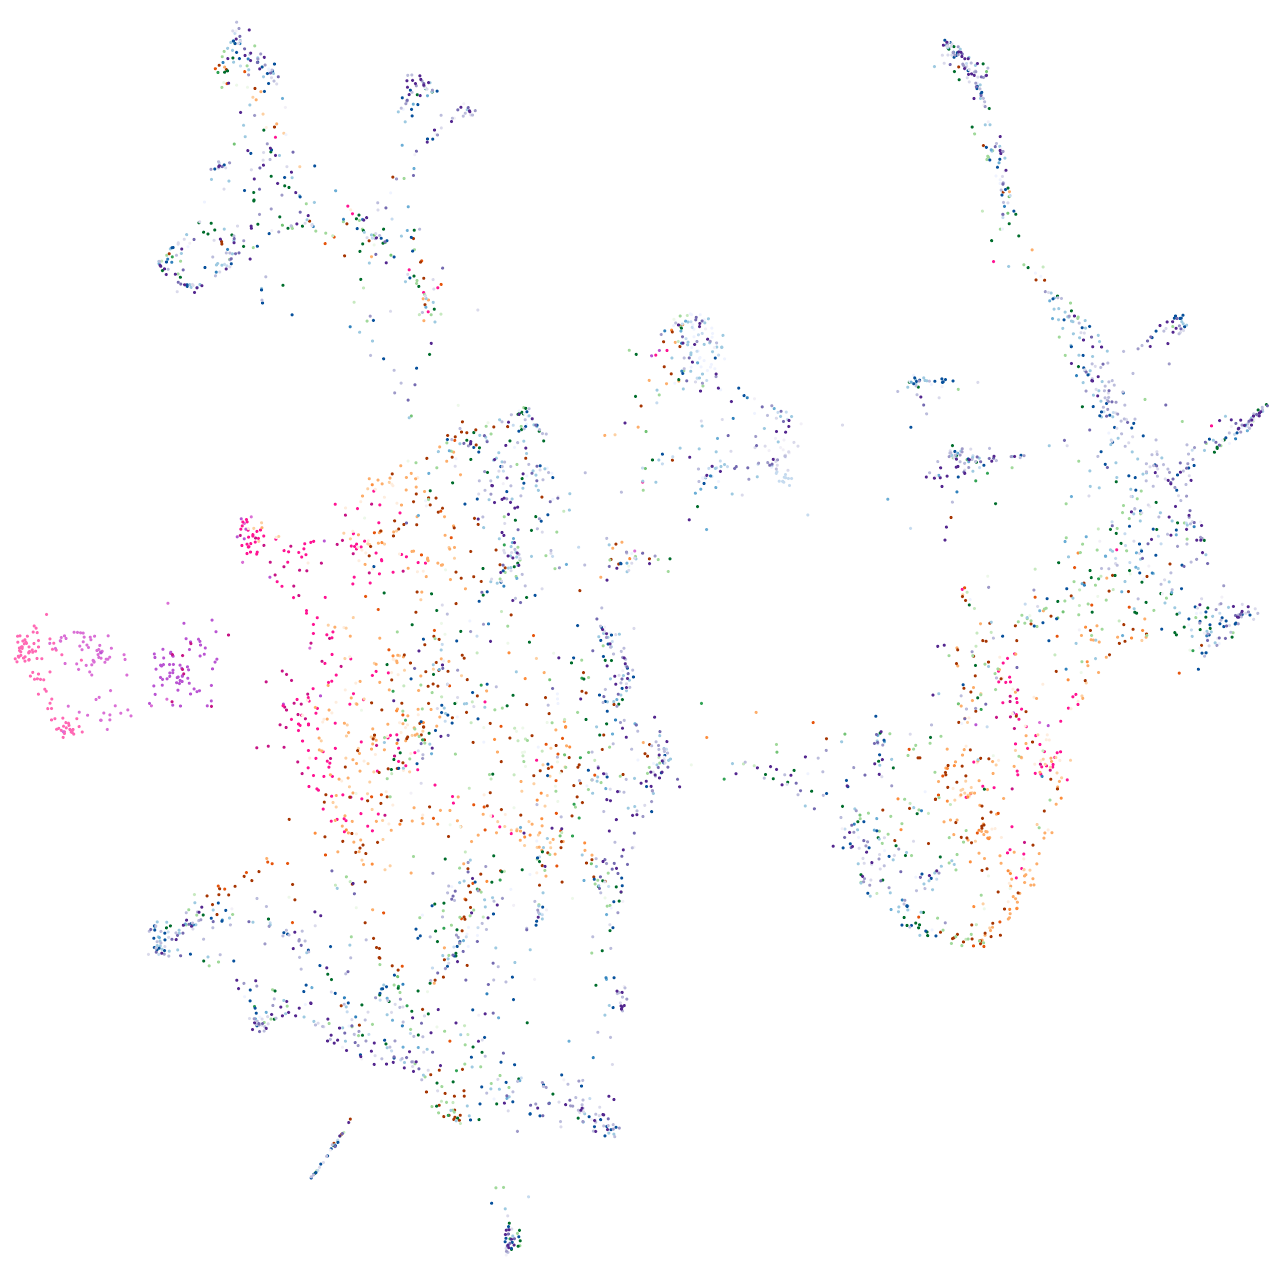
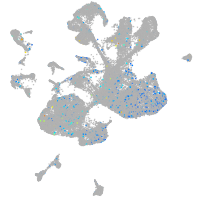
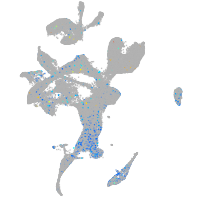
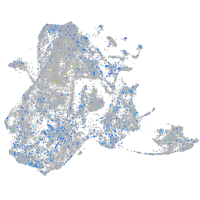
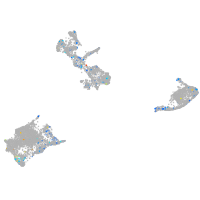
Expression by stage/cluster
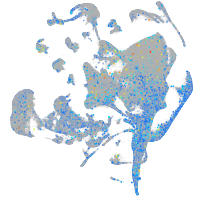
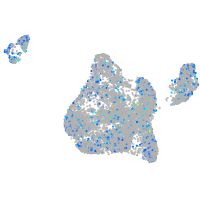
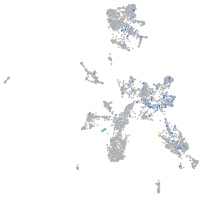
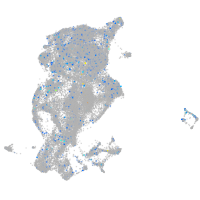
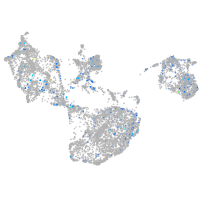
Correlated gene expression
Positive correlation
Negative correlation
Gene
r
Gene
r
apobb.2
0.161
zgc:158463
-0.055
dusp3b
0.157
fzr1b
-0.045
BX957256.1
0.149
LOC110439372
-0.041
h2af1al
0.146
nsfa
-0.041
alox5ap
0.142
amigo3
-0.040
chst8.1
0.130
prss35
-0.037
sgca
0.130
dmtn
-0.037
CR749763.2
0.128
copz2
-0.037
c3b.2
0.123
atp5f1e
-0.036
si:ch211-180a12.2
0.122
pou3f3b
-0.035
AL929276.2
0.121
taok1a
-0.035
clrn3
0.120
ndnfl
-0.034
LOC103910556
0.114
ttn.2
-0.034
LOC101883185
0.108
nfkbiz
-0.034
ccl33.3
0.105
ube2h
-0.033
gbp4
0.104
lin7b
-0.033
si:ch211-141o9.10
0.104
uba5
-0.033
si:ch211-173d10.4
0.103
natd1
-0.033
tymp
0.103
si:ch211-117c9.5
-0.033
CU457778.1
0.103
reep1
-0.033
znfl1g
0.102
kidins220b
-0.033
st3gal7
0.100
MANEAL
-0.033
LOC110438313
0.100
golga2
-0.033
XLOC-028339
0.099
shisal1a
-0.032
BX005372.1
0.099
LOC110439812
-0.032
CABZ01039782.1
0.099
nr2f1a
-0.032
rdh5
0.098
rnf103
-0.032
m17
0.098
mapk10
-0.032
si:ch211-261n11.8
0.098
cox8b
-0.032
ftr14l
0.098
pvalb2
-0.031
CU302316.1
0.097
ckmt1
-0.031
mhc1zca
0.096
picalma
-0.031
si:ch1073-464p5.5
0.096
stx5a
-0.031
LOC101885484
0.095
pcdh20
-0.031
XLOC-023769
0.094
lye
-0.031