
"casein kinase 1, delta a"
ZFIN 
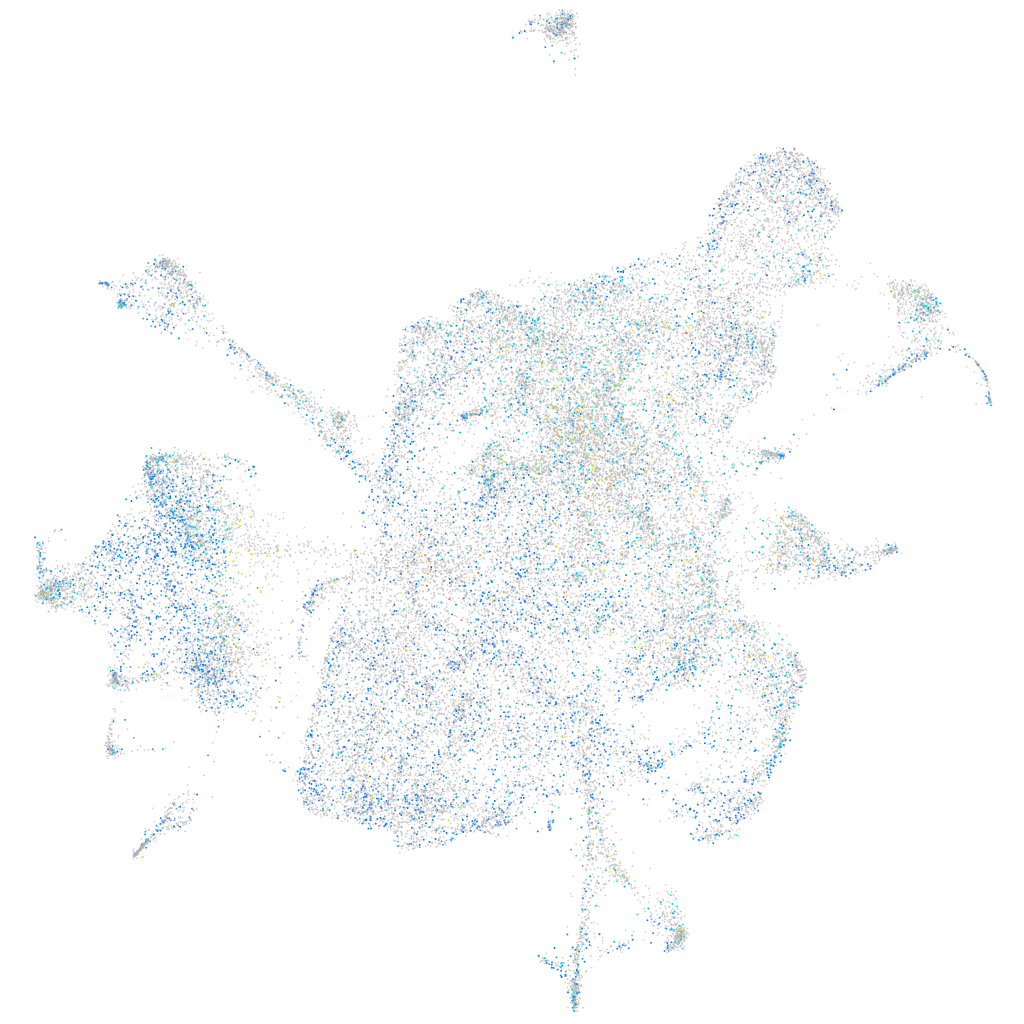
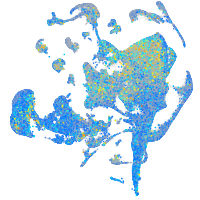
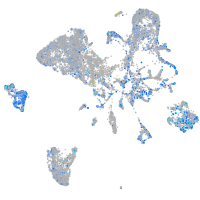
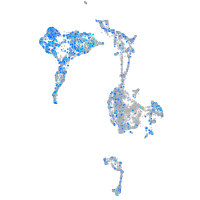
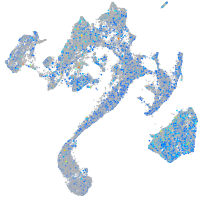
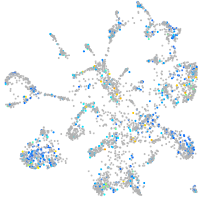
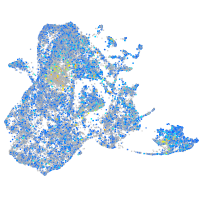
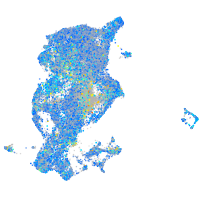
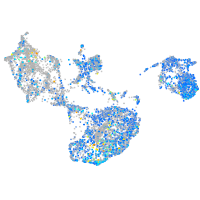
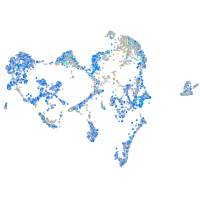
Gene expression UMAP


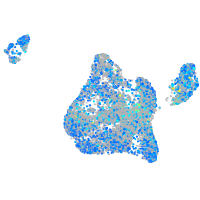
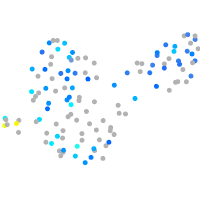
Expression by stage/cluster
Correlated gene expression
| Positive correlation | Negative correlation | ||
| Gene | r | Gene | r |
| tuba1c | 0.069 | si:dkey-151g10.6 | -0.053 |
| gpm6aa | 0.069 | rps29 | -0.052 |
| elavl3 | 0.068 | rplp1 | -0.049 |
| nova2 | 0.064 | rpl39 | -0.045 |
| rtn1a | 0.063 | rpl38 | -0.045 |
| stmn1b | 0.062 | rpl29 | -0.044 |
| tubb5 | 0.061 | rpl37 | -0.042 |
| ckbb | 0.061 | rps28 | -0.040 |
| gng3 | 0.060 | rpl36a | -0.039 |
| myt1a | 0.059 | rplp2l | -0.036 |
| tuba1a | 0.058 | rps24 | -0.034 |
| si:ch211-137a8.4 | 0.057 | rps21 | -0.034 |
| elovl4a | 0.057 | rps15 | -0.032 |
| fez1 | 0.056 | rpl35a | -0.031 |
| si:dkey-276j7.1 | 0.056 | rps19 | -0.031 |
| celf2 | 0.055 | rps12 | -0.031 |
| hmgb1b | 0.055 | rps15a | -0.030 |
| h2afx1 | 0.055 | otos | -0.030 |
| tmsb | 0.054 | rps14 | -0.029 |
| rtn1b | 0.054 | rps23 | -0.028 |
| gpm6ab | 0.054 | rpl23 | -0.027 |
| mt-cyb | 0.053 | rps20 | -0.027 |
| tmeff1b | 0.053 | rpl28 | -0.027 |
| myt1b | 0.053 | itga10 | -0.027 |
| insm1a | 0.053 | rpl26 | -0.026 |
| zc4h2 | 0.053 | rps27a | -0.026 |
| hnrnpa0a | 0.052 | col2a1a | -0.026 |
| scrt2 | 0.052 | rps26l | -0.025 |
| zgc:65894 | 0.052 | rps25 | -0.025 |
| marcksb | 0.052 | rpl35 | -0.025 |
| top2b | 0.052 | col11a2 | -0.025 |
| ubb | 0.052 | rpl36 | -0.025 |
| mllt11 | 0.052 | rps8a | -0.025 |
| kif5bb | 0.051 | matn1 | -0.024 |
| epb41a | 0.051 | rpl21 | -0.024 |