Daniocell
crybg1a (pronephros)
crystallin beta-gamma domain containing 1a
ZFIN
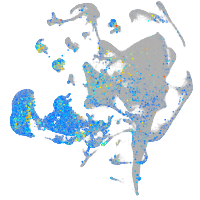
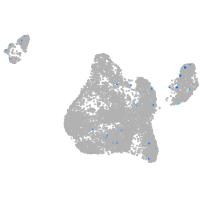
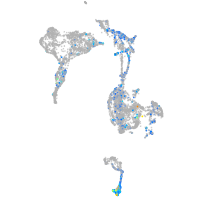
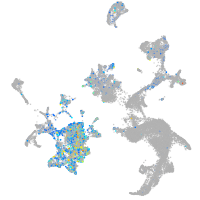
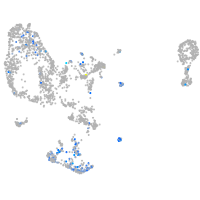
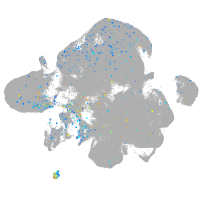
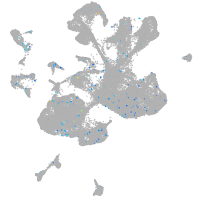
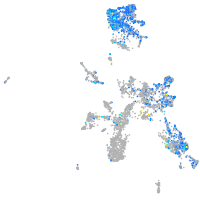
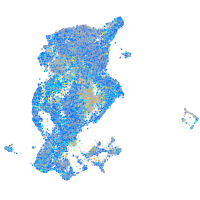
Gene expression UMAP
Display:
Expression
Stage
Other cell groups
all cells
blastomeres
PGCs
endoderm
axial mesoderm
muscle
mural cells /
non-skeletal muscle
mesenchyme
hematopoietic /
vasculature
pronephros
neural
spinal cord / glia
eye
taste / olfactory
otic / lateral line
epidermis
periderm
fin
ionocytes / mucous
pigment cells
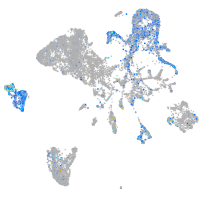
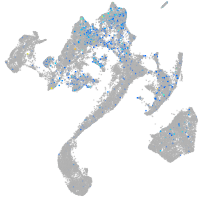
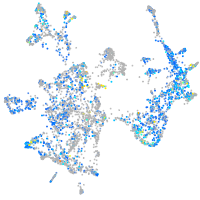
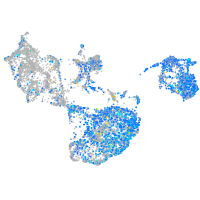
Expression by stage/cluster
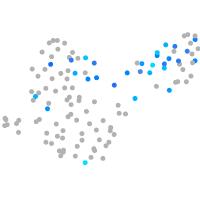
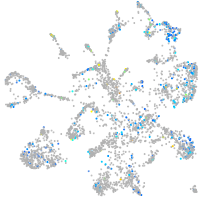
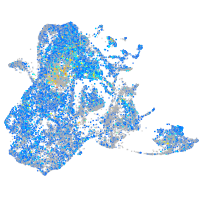
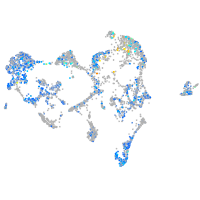
Correlated gene expression
Positive correlation
Negative correlation
Gene
r
Gene
r
ahnak
0.308
acy3.2
-0.151
anxa1a
0.272
si:rp71-17i16.6
-0.123
sesn1
0.267
aqp8b
-0.118
tmem176l.4
0.261
LOC101883320
-0.113
XLOC-002816
0.258
slc4a4a
-0.113
LO017718.1
0.258
slc26a6
-0.111
malb
0.257
eif5a2
-0.108
LOC110438262
0.256
lrpap1
-0.108
XLOC-000490
0.255
gnpda1
-0.107
zgc:158423
0.254
nucks1a
-0.107
phlda2
0.254
dab2
-0.106
ptgs2b
0.252
ggt1b
-0.106
si:dkey-259j3.5
0.252
hnrnpabb
-0.105
kitlgb
0.252
si:dkey-151g10.6
-0.105
LOC101884298
0.245
ptmab
-0.102
tmsb1
0.244
wu:fb97g03
-0.102
LOC101882789
0.243
add3a
-0.099
CT997819.3
0.243
hspb1
-0.098
itgb4
0.241
rps12
-0.098
si:dkey-73p2.2
0.239
lrp2a
-0.097
ch25hl1.1
0.238
snrpf
-0.097
bsnd
0.236
slc26a1
-0.094
clcnk
0.234
osgn1
-0.094
rnf183
0.234
fmo5
-0.094
wu:fc38h03
0.232
zgc:136493
-0.093
LO018437.1
0.232
hnrnpa1a
-0.093
gpr88
0.232
tpte
-0.092
LOC103911742
0.231
grhprb
-0.092
si:ch73-359m17.9
0.228
srrm2
-0.092
CABZ01059408.1
0.228
slc9a3r1a
-0.092
zgc:86896
0.228
si:dkey-194e6.1
-0.092
mal2
0.226
seta
-0.090
mapk12a
0.226
mafa
-0.090
ppp1r1b
0.225
slc2a1a
-0.090
lgals3b
0.225
apoc1
-0.090