Daniocell
crfb15 (mesenchyme)
cytokine receptor family member B15
ZFIN
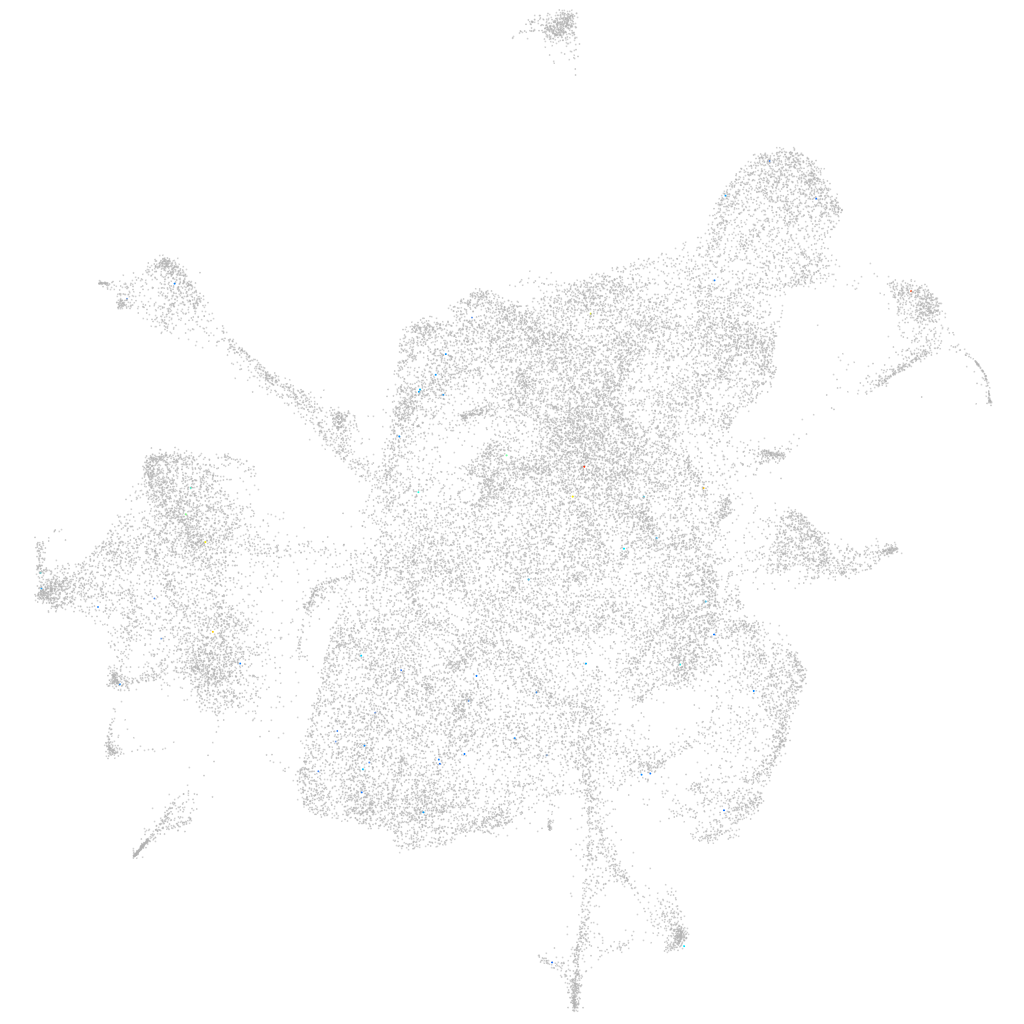
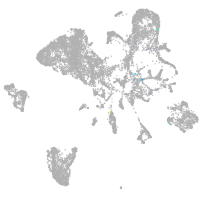
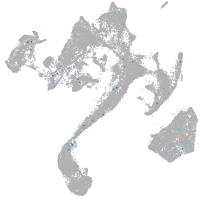
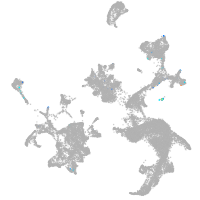
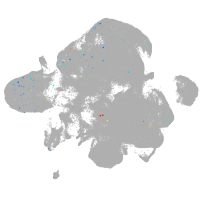
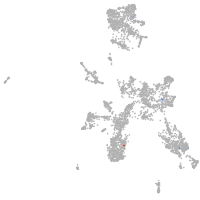
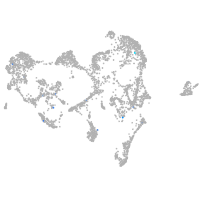
Gene expression UMAP
Display:
Expression
Stage
Other cell groups
all cells
blastomeres
PGCs
endoderm
axial mesoderm
muscle
mural cells /
non-skeletal muscle
mesenchyme
hematopoietic /
vasculature
pronephros
neural
spinal cord / glia
eye
taste / olfactory
otic / lateral line
epidermis
periderm
fin
ionocytes / mucous
pigment cells
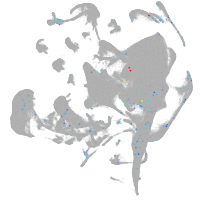
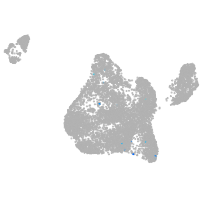
Expression by stage/cluster
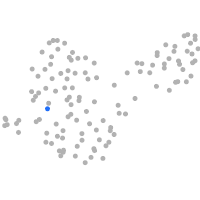
Correlated gene expression
Positive correlation
Negative correlation
Gene
r
Gene
r
LOC100534786
0.145
rpl10a
-0.021
LOC110437769
0.125
rpl39
-0.014
tradv24.0.1
0.120
rps4x
-0.012
XLOC-021306
0.101
pgpep1
-0.011
CR848784.5
0.100
pvalb1
-0.011
si:dkey-102g19.3
0.091
rps9
-0.011
BX571945.2
0.087
rps3a
-0.010
asb4
0.087
capns1a
-0.010
znfl1h
0.086
col8a2
-0.010
or132-1
0.085
hbegfa
-0.010
XLOC-014398
0.081
psmd12
-0.009
nfe2l2b
0.081
tgfbr2b
-0.009
si:ch211-196f2.6
0.080
nt5dc2
-0.009
XLOC-013811
0.078
sdf4
-0.009
BX323559.4
0.073
ucp2
-0.009
CU467646.6
0.073
klf2a
-0.009
NABP2
0.068
si:ch211-251b21.1
-0.009
prg4b
0.064
fbxl7
-0.009
zgc:113424
0.063
vps29
-0.009
CR932360.2
0.063
ptprda
-0.009
prf1.6
0.062
rps7
-0.009
LOC100007738
0.061
tp53inp2
-0.009
CU694255.2
0.061
gli2a
-0.008
LOC101886911
0.059
rpl22
-0.008
MGAT5B
0.056
khdrbs1b
-0.008
LOC110440170
0.053
glo1
-0.008
strip2
0.051
cyt1
-0.008
klhl33
0.049
rps12
-0.008
si:ch211-175f12.2
0.048
myhz1.2
-0.008
flt3
0.048
smad1
-0.008
LOC103911600
0.048
lpar1
-0.008
CT573787.1
0.047
col9a1a
-0.008
LOC555502
0.047
arpc1b
-0.008
tox4b
0.046
ptbp2a
-0.008
pak7
0.045
hnrnpl
-0.008