Daniocell
cpt1aa (otic / lateral line)
carnitine palmitoyltransferase 1Aa (liver)
ZFIN
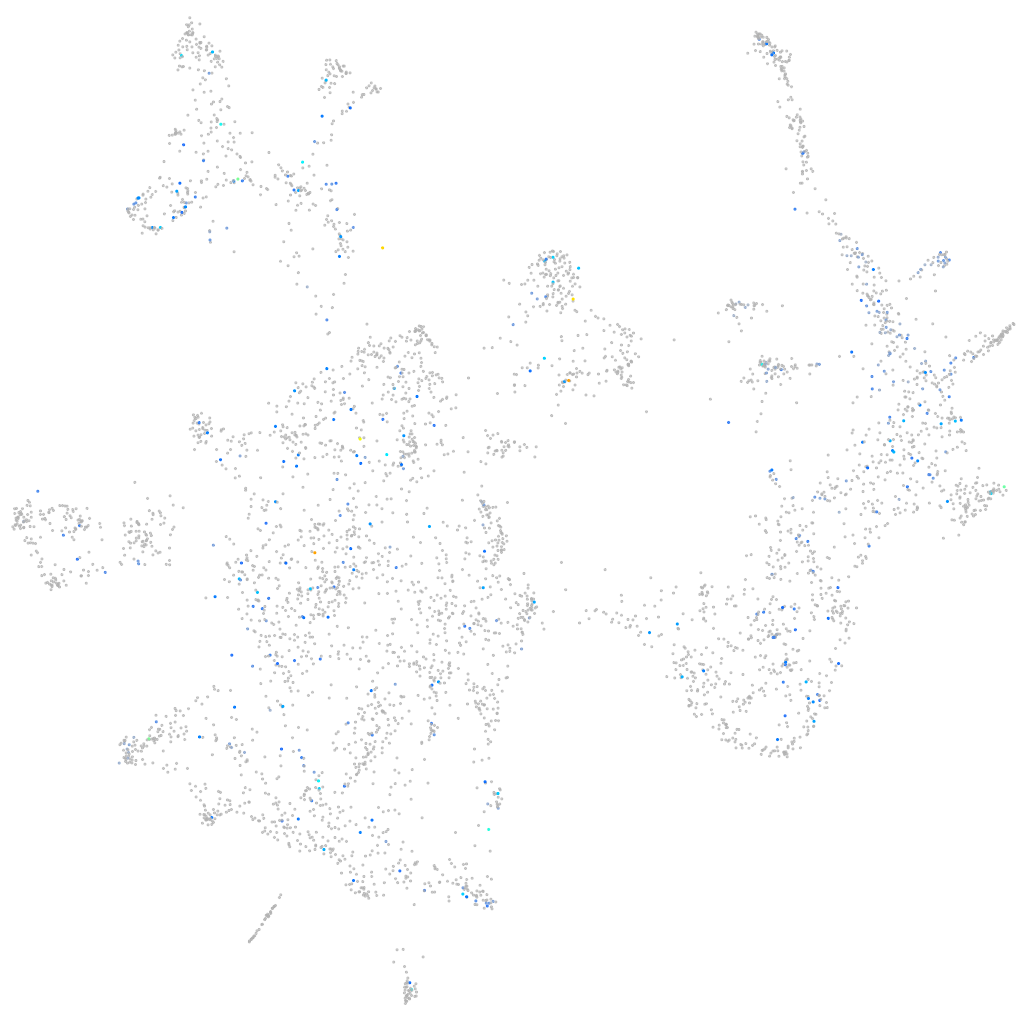
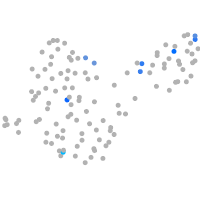
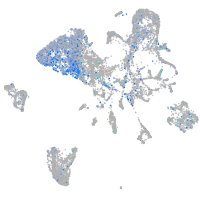
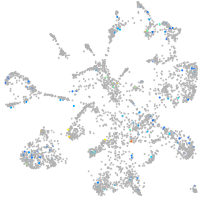
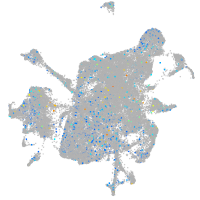
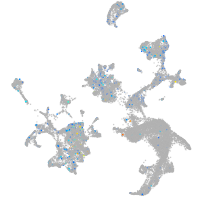
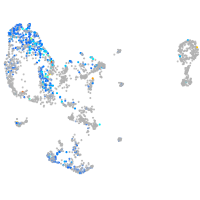
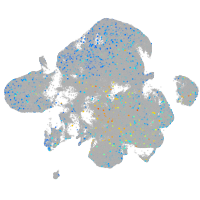
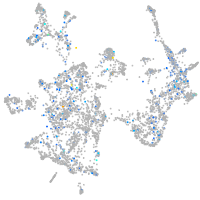
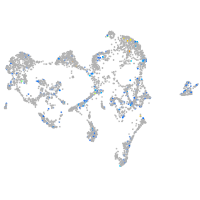
Gene expression UMAP
Display:
Expression
Stage
Other cell groups
all cells
blastomeres
PGCs
endoderm
axial mesoderm
muscle
mural cells /
non-skeletal muscle
mesenchyme
hematopoietic /
vasculature
pronephros
neural
spinal cord / glia
eye
taste / olfactory
otic / lateral line
epidermis
periderm
fin
ionocytes / mucous
pigment cells
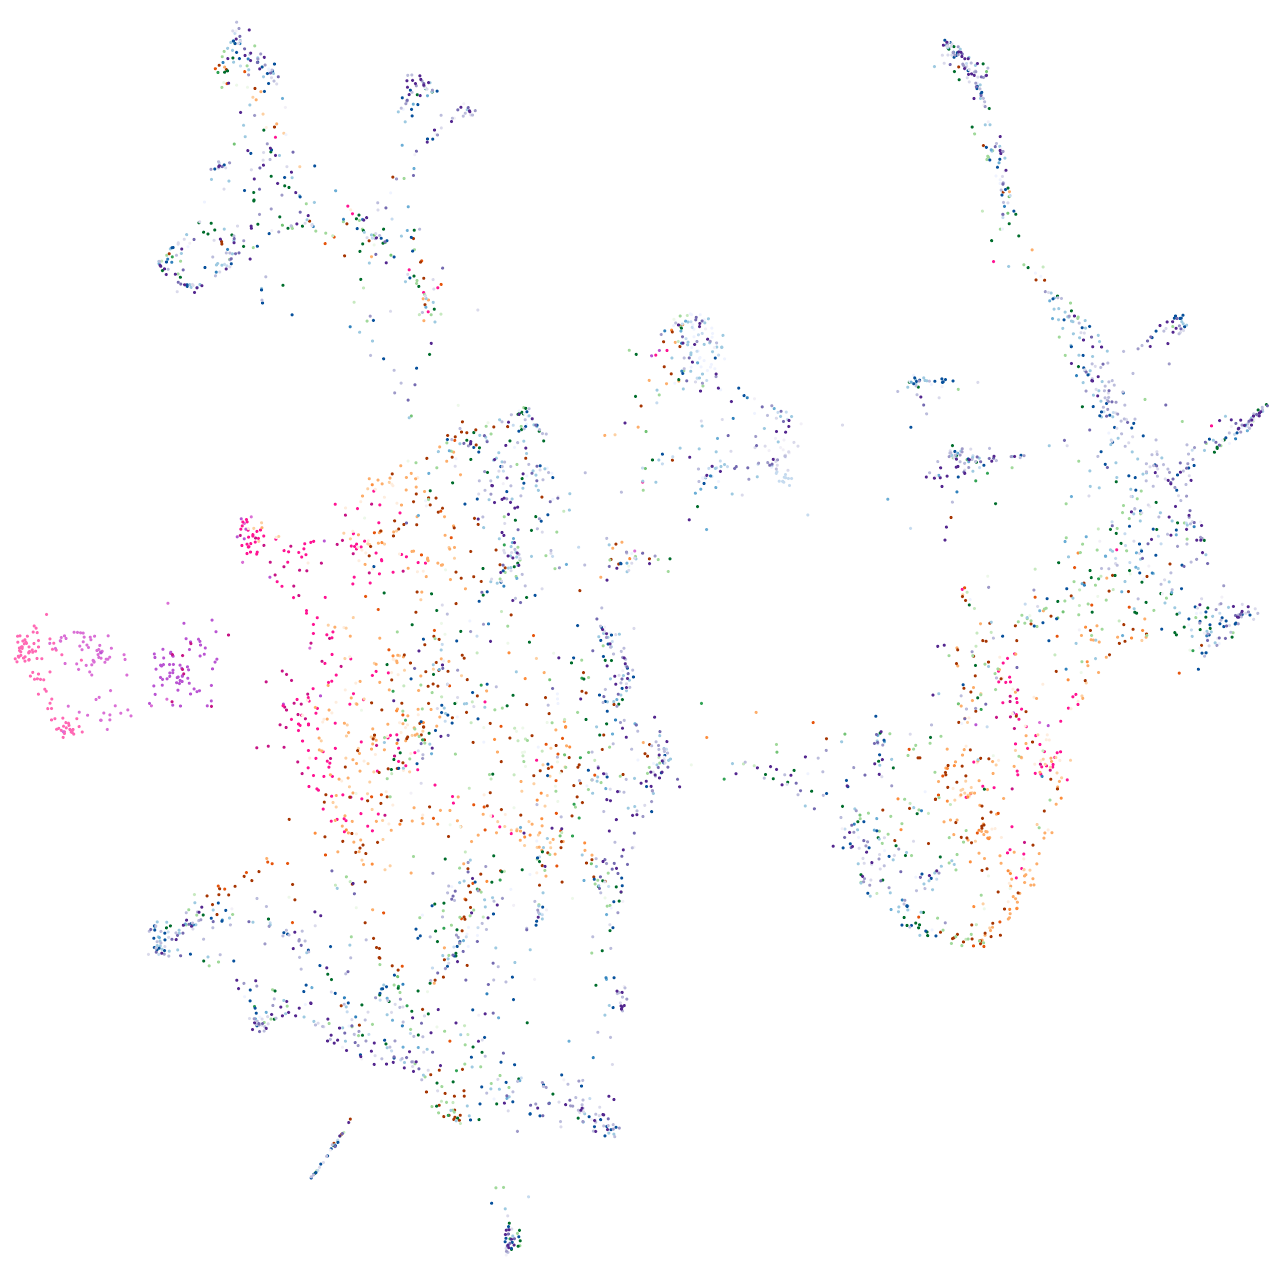
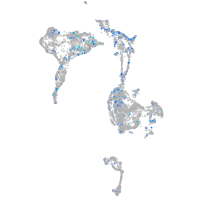
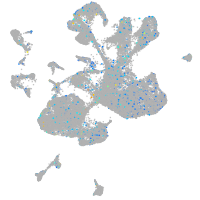
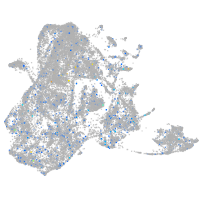
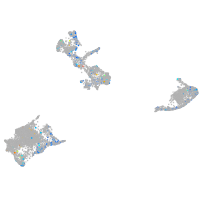
Expression by stage/cluster
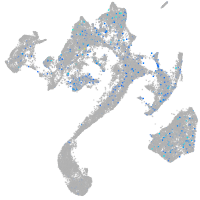
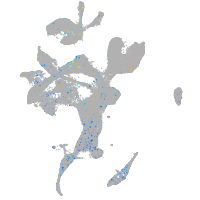
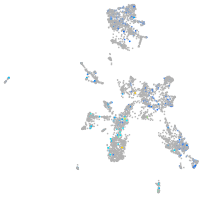
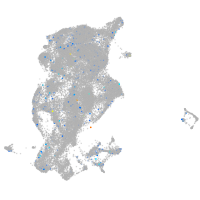
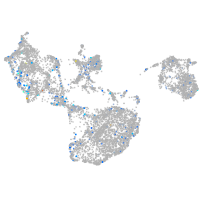
Correlated gene expression
Positive correlation
Negative correlation
Gene
r
Gene
r
si:ch1073-44g3.1
0.199
agr2
-0.053
LOC110438082
0.189
bricd5
-0.040
LOC108182317
0.189
ms4a17a.9
-0.040
si:ch1073-159d7.10
0.169
fbln7
-0.038
gp9
0.156
CR751602.2
-0.036
si:dkey-28d5.13
0.155
b3gnt7
-0.036
LOC795526
0.154
jam2b
-0.036
si:ch211-229l10.4
0.153
zgc:101130
-0.036
si:dkey-163m14.7
0.151
fam20cb
-0.036
slc2a3b
0.137
ctnna1
-0.035
XLOC-043567
0.135
zgc:92664
-0.034
evx2
0.134
endouc
-0.034
BX470218.1
0.130
smyhc1
-0.034
LOC110439997
0.124
sfrp1a
-0.034
BX000438.1
0.118
fgf20b
-0.034
grm8b
0.117
stm
-0.034
cyth4b
0.116
col2a1a
-0.033
sstr1b
0.115
cldna
-0.033
tfb2m
0.112
efhd1
-0.033
GNG4
0.110
mfap2
-0.033
ankmy1
0.109
si:dkey-28b4.7
-0.033
zgc:174564
0.109
ptprz1b
-0.032
LOC110438228
0.107
myhz1.1
-0.032
si:dkey-256i11.3
0.106
fam199x
-0.032
CU595864.1
0.106
myl10
-0.032
XLOC-011417
0.106
si:ch211-133n4.6
-0.032
nectin1a
0.106
cpa5
-0.032
si:dkey-174m14.3
0.105
cbwd
-0.031
ccdc78
0.103
tiparp
-0.031
BX539307.1
0.103
ak3
-0.031
hs3st4
0.101
sema3aa
-0.031
si:ch73-68b22.2
0.101
slc25a22b
-0.031
mmp17b
0.100
mgst3b
-0.031
si:ch211-207k7.4
0.100
sept10
-0.031
LOC110438283
0.099
pvalb4
-0.031