Daniocell
cox4i1 (taste / olfactory)
cytochrome c oxidase subunit 4I1
ZFIN
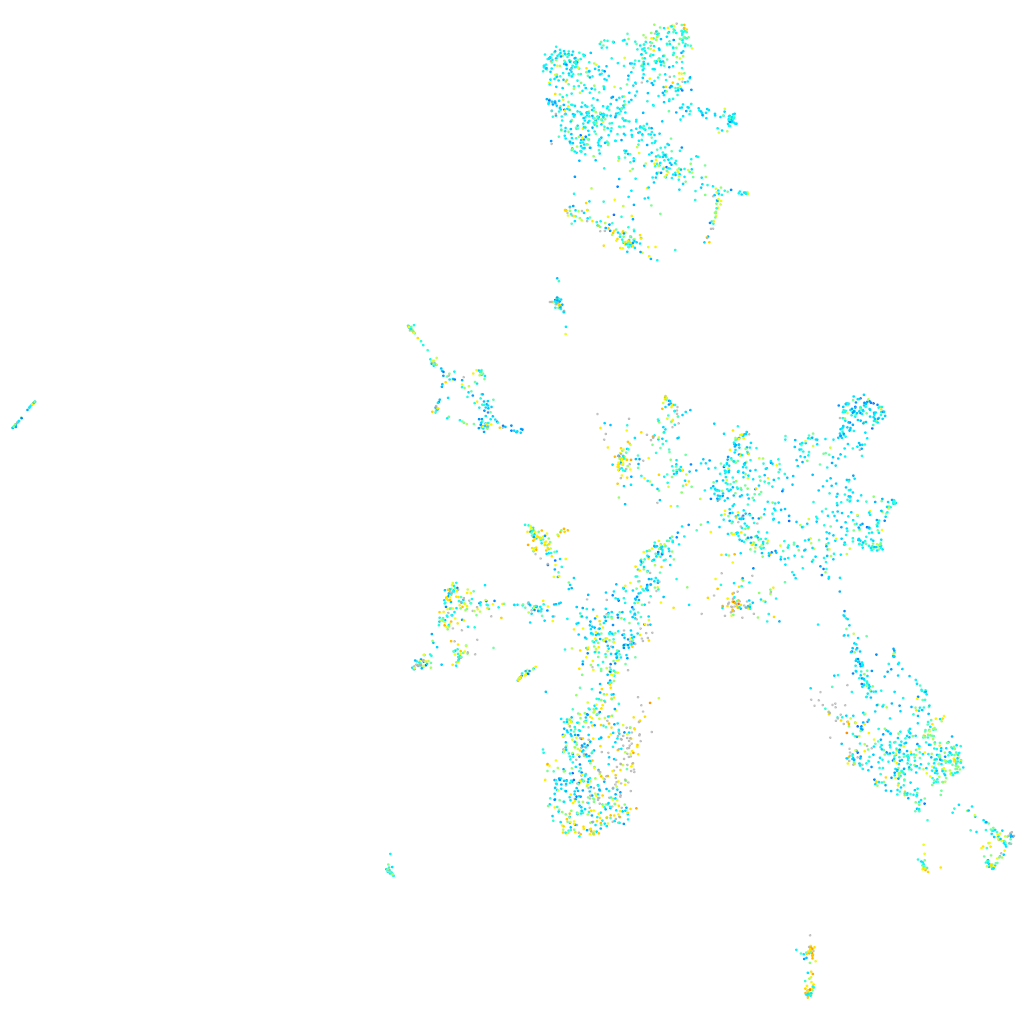
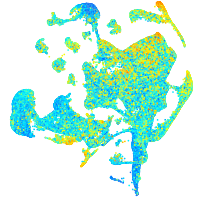
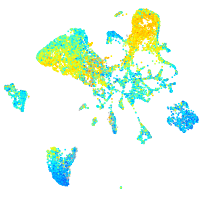
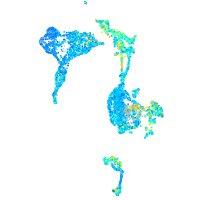
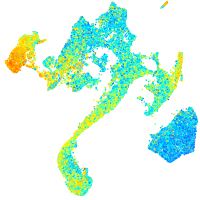
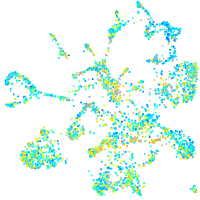
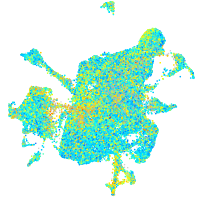
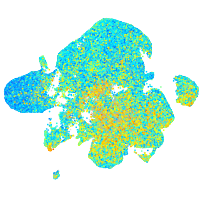
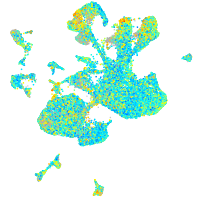
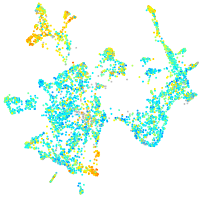
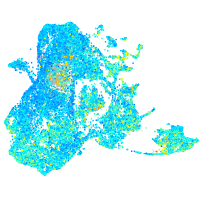
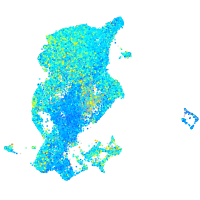
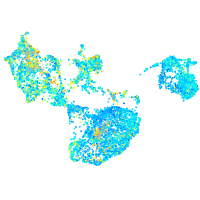
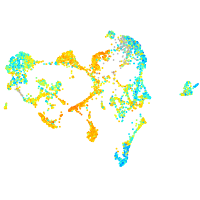
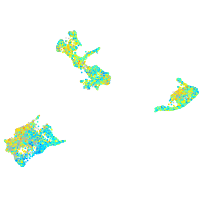
Gene expression UMAP
Display:
Expression
Stage
Other cell groups
all cells
blastomeres
PGCs
endoderm
axial mesoderm
muscle
mural cells /
non-skeletal muscle
mesenchyme
hematopoietic /
vasculature
pronephros
neural
spinal cord / glia
eye
taste / olfactory
otic / lateral line
epidermis
periderm
fin
ionocytes / mucous
pigment cells
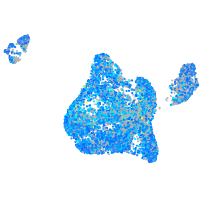
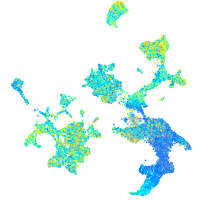
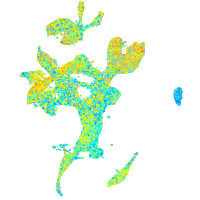
Expression by stage/cluster
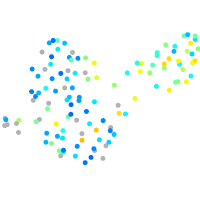
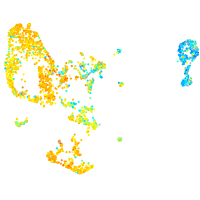
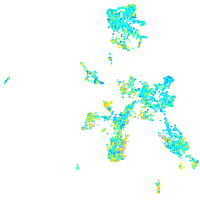
Correlated gene expression
Positive correlation
Negative correlation
Gene
r
Gene
r
atp5f1b
0.256
LOC110439372
-0.103
vdac2
0.250
NC-002333.4
-0.102
atp5mc3b
0.248
mt-co1
-0.102
atp5mc1
0.234
RF00009
-0.096
cyc1
0.232
zgc:158463
-0.090
atp5fa1
0.227
BX323564.1
-0.083
cox5aa
0.226
sall1b
-0.079
cox6a1
0.216
flrt2
-0.079
atp5pb
0.214
CABZ01072614.1
-0.076
atp5f1d
0.214
adgrl3.1
-0.075
ndufab1b
0.213
si:ch1073-83n3.2
-0.074
cycsb
0.213
cacnb2b
-0.072
si:ch1073-325m22.2
0.211
CR383668.2
-0.071
ndufb8
0.211
csmd1a
-0.071
COX5B
0.208
si:ch1073-159d7.6
-0.071
aldoaa
0.207
bcan
-0.071
cox7a2a
0.205
add3b
-0.069
cox6b2
0.203
rn7sk
-0.069
slc25a3b
0.203
rpl29
-0.065
slc25a5
0.199
NC-002333.17
-0.065
atp5mc3a
0.198
BX640537.2
-0.064
uqcrc1
0.195
NC-002333.19
-0.064
atp5f1c
0.189
si:ch211-270n8.4
-0.063
uqcrh
0.188
si:dkey-27d5.4
-0.063
vdac1
0.188
prkcba
-0.063
arf2b
0.188
ptprq
-0.062
atp5if1b
0.187
gabrr3b
-0.062
tpi1b
0.187
insc
-0.062
ndufa8
0.186
si:dkey-61l1.4
-0.062
atp5l
0.186
LOC108191590
-0.062
ndufb4
0.186
si:ch211-236k19.2
-0.062
mpc2
0.186
avp
-0.061
ldhba
0.185
unc5a
-0.061
cox8a
0.184
dpp4
-0.061
psma5
0.183
bbc3
-0.060