Daniocell
cog3 (pronephros)
component of oligomeric golgi complex 3
ZFIN
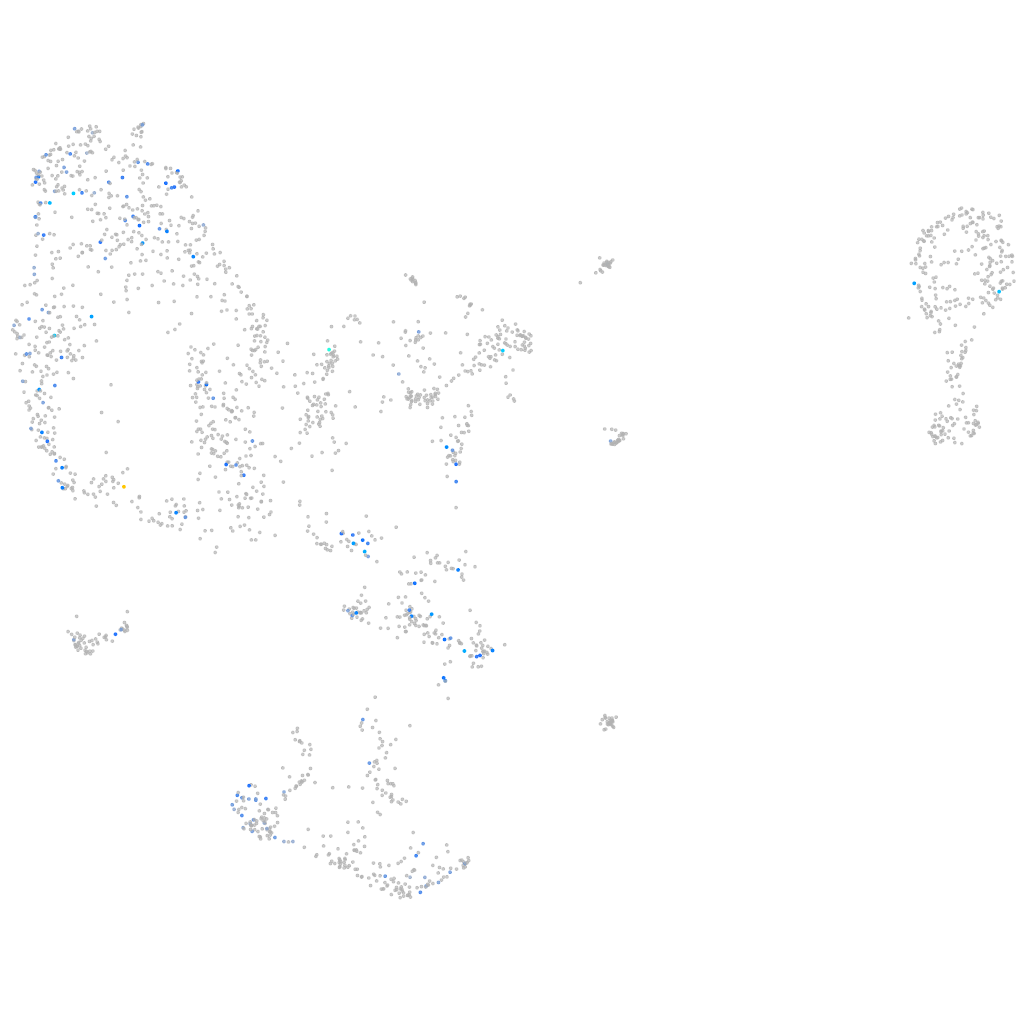
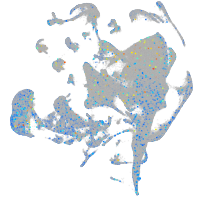
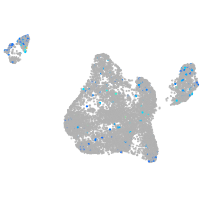
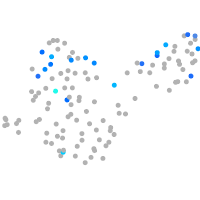
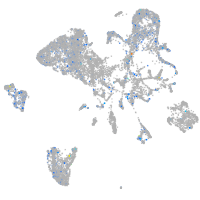
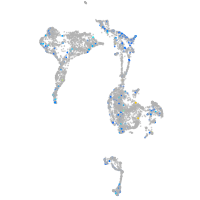
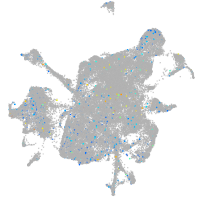
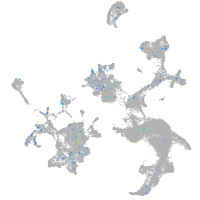
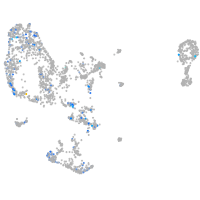
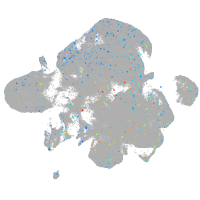
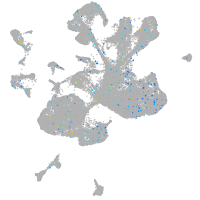
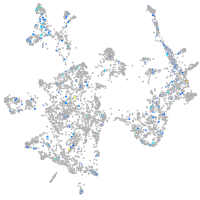
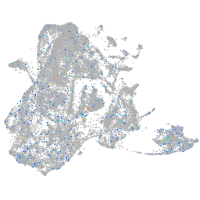
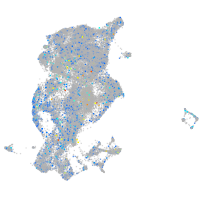
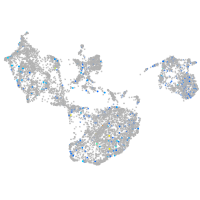
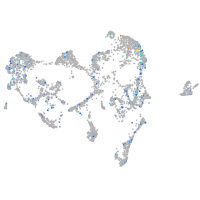
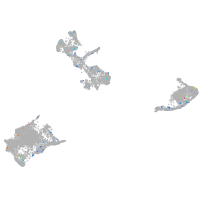
Gene expression UMAP
Display:
Expression
Stage
Other cell groups
all cells
blastomeres
PGCs
endoderm
axial mesoderm
muscle
mural cells /
non-skeletal muscle
mesenchyme
hematopoietic /
vasculature
pronephros
neural
spinal cord / glia
eye
taste / olfactory
otic / lateral line
epidermis
periderm
fin
ionocytes / mucous
pigment cells
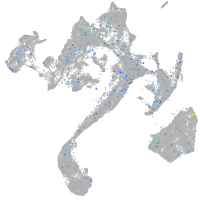
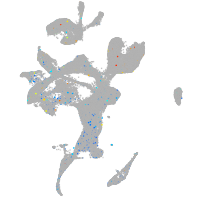
Expression by stage/cluster
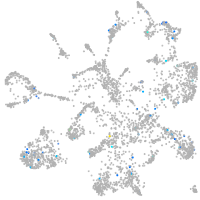
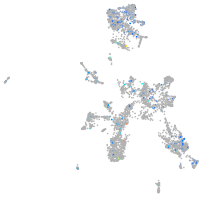
Correlated gene expression
Positive correlation
Negative correlation
Gene
r
Gene
r
zgc:103755
0.311
NC-002333.4
-0.062
XLOC-043229
0.297
gnl3
-0.060
grapb
0.267
plk3
-0.059
LOC101885698
0.249
si:ch73-1a9.3
-0.059
sec14l7
0.242
serpinh1b
-0.059
si:ch211-57f7.7
0.226
wdr46
-0.058
si:ch211-63p21.8
0.222
si:dkey-66i24.9
-0.058
gstk4
0.220
cxcl12a
-0.057
rnf220b
0.205
tsr1
-0.057
LOC101883106
0.191
cxcl12b
-0.056
XLOC-029275
0.185
tal1
-0.054
tm6sf2
0.180
acin1a
-0.053
BX005085.1
0.180
si:ch73-299h12.3
-0.052
zgc:171509
0.174
ddx51
-0.052
LOC101882592
0.174
apoc1
-0.052
pde5aa
0.170
metap2b
-0.052
mc5rb
0.167
snrnp70
-0.052
cthrc1b
0.165
wnt5b
-0.050
si:dkey-178e17.1
0.165
exosc10
-0.050
ftr06
0.163
asph
-0.050
XLOC-023835
0.159
ndrg2
-0.050
kif26bb
0.155
marcksl1b
-0.050
XLOC-002638
0.155
si:ch73-281n10.2
-0.049
XLOC-022245
0.153
krr1
-0.049
star
0.152
si:dkey-239h2.3
-0.048
cldn15b
0.151
mphosph10
-0.047
kcnk17
0.149
cactin
-0.047
gdpd3b
0.148
nolc1
-0.047
dennd1a
0.147
ebna1bp2
-0.047
tmem121b
0.146
wu:fb97g03
-0.047
XLOC-016432
0.145
si:dkey-188h10.3
-0.047
rem2
0.144
cdx4
-0.046
ftr12
0.144
ISCU
-0.046
ralgapb
0.141
si:dkey-261j4.5
-0.046
si:ch73-379j16.2
0.140
luc7l3
-0.045