Daniocell
cnsta (hematopoietic / vasculature)
"consortin, connexin sorting protein a"
ZFIN
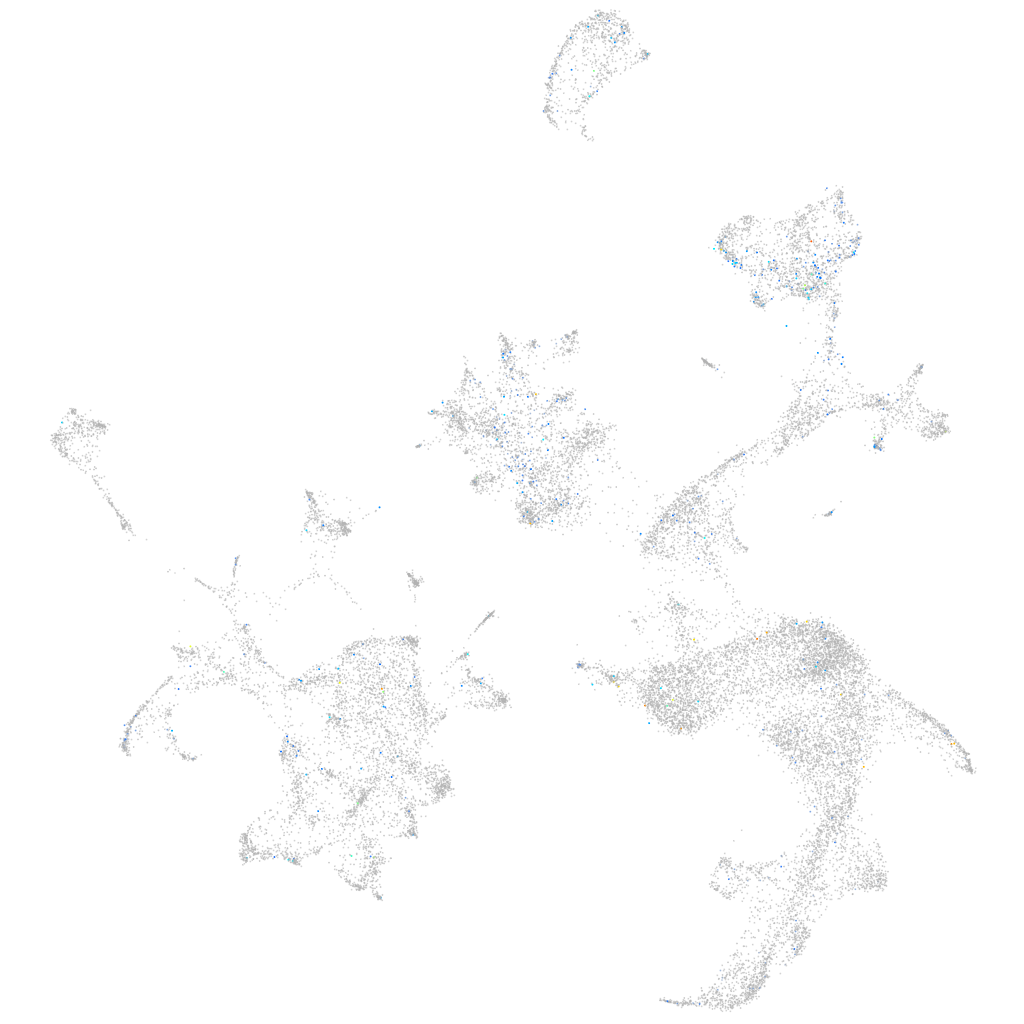
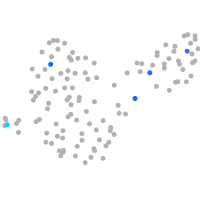
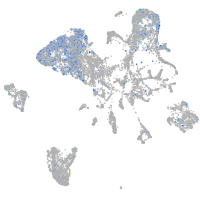
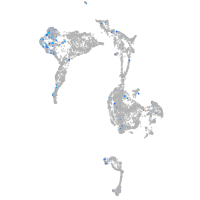
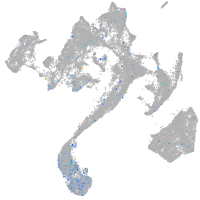
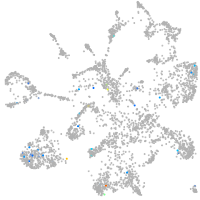
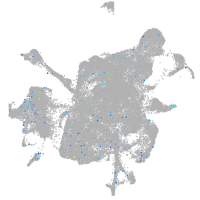
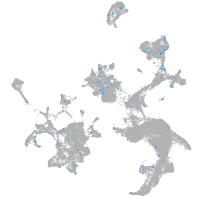
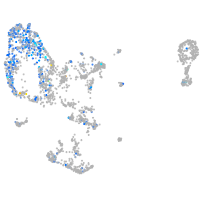
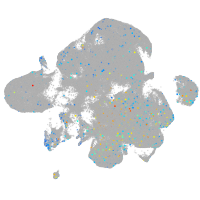
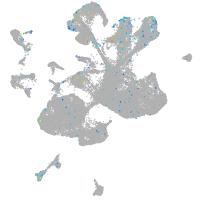
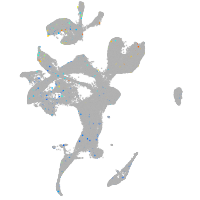
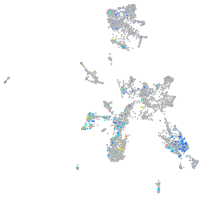
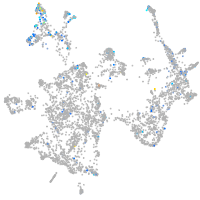
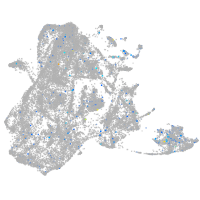
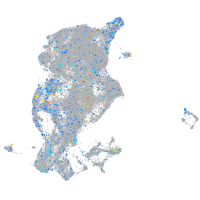
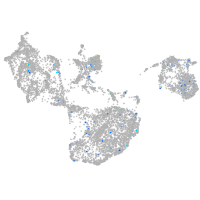
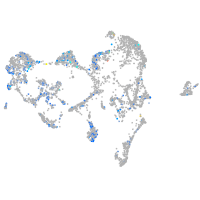
Gene expression UMAP
Display:
Expression
Stage
Other cell groups
all cells
blastomeres
PGCs
endoderm
axial mesoderm
muscle
mural cells /
non-skeletal muscle
mesenchyme
hematopoietic /
vasculature
pronephros
neural
spinal cord / glia
eye
taste / olfactory
otic / lateral line
epidermis
periderm
fin
ionocytes / mucous
pigment cells
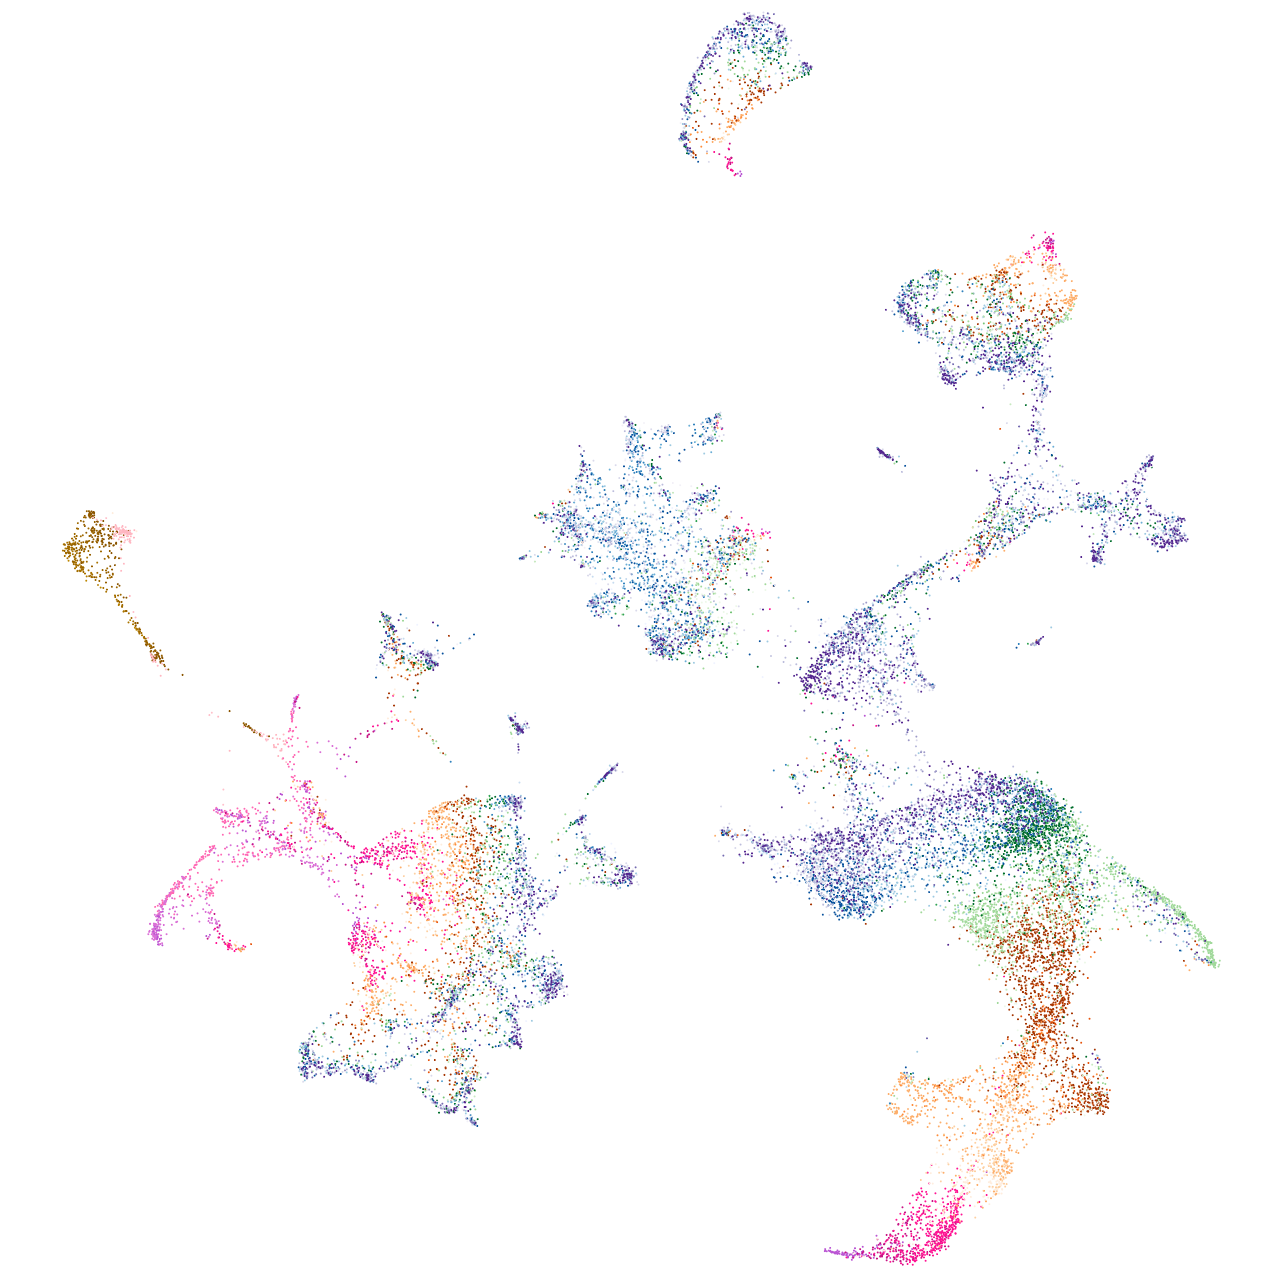
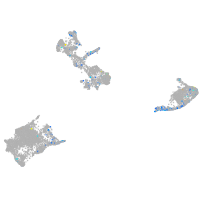
Expression by stage/cluster
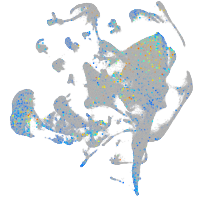
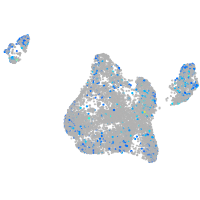
Correlated gene expression
Positive correlation
Negative correlation
Gene
r
Gene
r
LOC110439880
0.149
hemgn
-0.043
cabz01076234.2
0.137
zgc:56095
-0.042
LOC101884915
0.124
tspo
-0.040
LOC103911950
0.113
hbae1.1
-0.039
mir183
0.112
cahz
-0.038
XLOC-033512
0.109
hbae1.3
-0.037
LOC103911911
0.107
hbbe1.3
-0.036
AL935303.1
0.102
hbbe1.1
-0.036
CU915770.1
0.093
zgc:163057
-0.035
si:dkey-31m5.5
0.093
hbbe3
-0.035
gm2a
0.091
slc4a1a
-0.035
si:zfos-1069f5.1
0.091
hbae3
-0.034
CR762431.1
0.090
hbbe2
-0.034
mpeg1.1
0.090
hbbe1.2
-0.033
ctss2.2
0.089
uros
-0.032
LOC110439851
0.088
nmt1b
-0.031
cmklr1
0.087
tmod4
-0.030
havcr1
0.086
ucp3
-0.030
cx32.2
0.086
fth1a
-0.029
si:ch211-102c2.4
0.085
hbae5
-0.029
si:ch73-158p21.3
0.085
blvrb
-0.029
nr4a1
0.084
alas2
-0.029
si:dkey-206d17.12
0.083
rfesd
-0.028
asah1b
0.083
glrx5
-0.027
rnaset2l
0.083
TCIM (1 of many)
-0.026
si:ch211-199g17.9
0.082
znfl2a
-0.026
slc3a2a
0.081
tfr1a
-0.026
itgae.1
0.081
hmbsb
-0.025
mfap4
0.080
nt5c2l1
-0.025
spi1a
0.080
rhd
-0.024
best1
0.080
fbxo32
-0.024
si:dkey-5n18.1
0.080
alad
-0.024
AL772241.2
0.079
tmem14ca
-0.024
fcer1gl
0.079
plac8l1
-0.023
CU499330.1
0.079
sptb
-0.023