Daniocell
cmss1 (mural cells / non-skeletal muscle)
cms1 ribosomal small subunit homolog
ZFIN
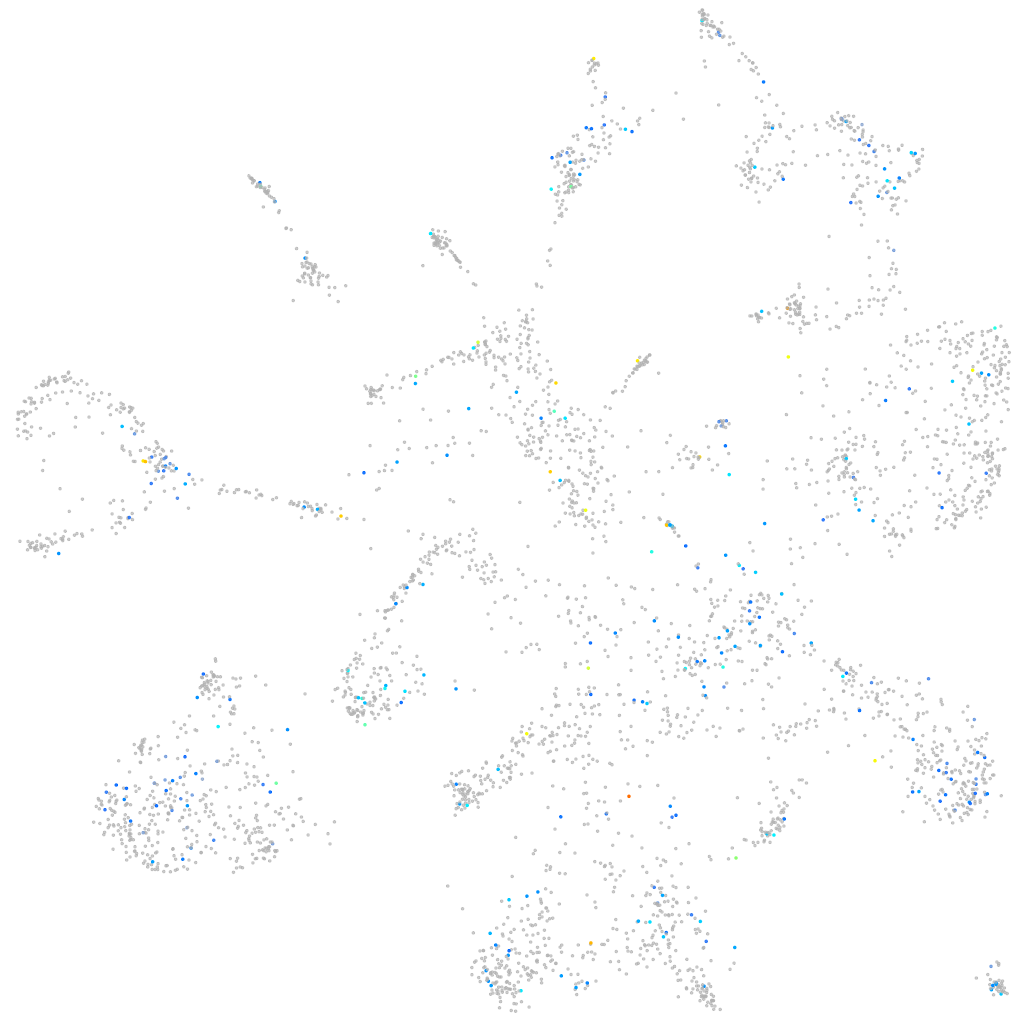
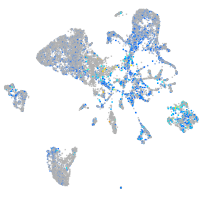
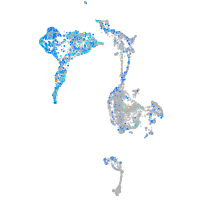
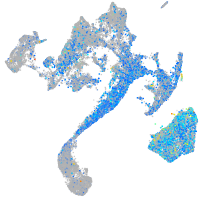
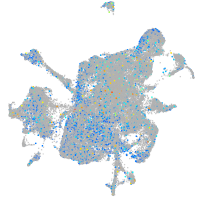
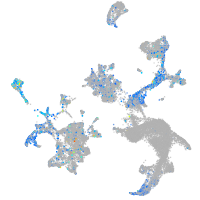
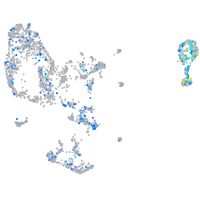
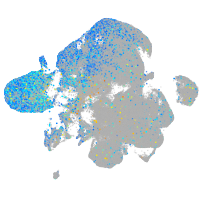
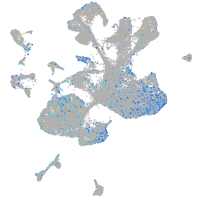
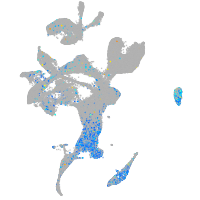
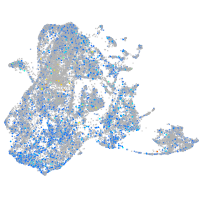
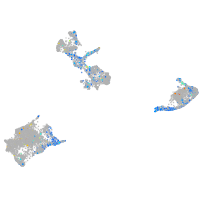
Gene expression UMAP
Display:
Expression
Stage
Other cell groups
all cells
blastomeres
PGCs
endoderm
axial mesoderm
muscle
mural cells /
non-skeletal muscle
mesenchyme
hematopoietic /
vasculature
pronephros
neural
spinal cord / glia
eye
taste / olfactory
otic / lateral line
epidermis
periderm
fin
ionocytes / mucous
pigment cells
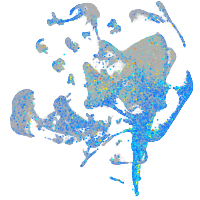
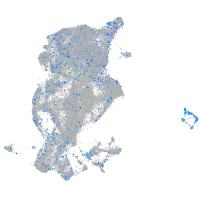
Expression by stage/cluster
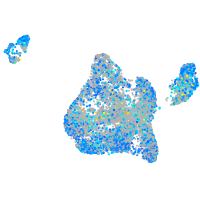
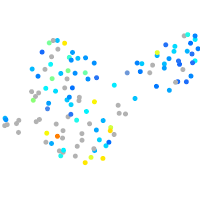
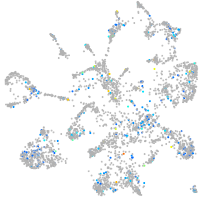
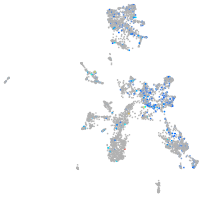
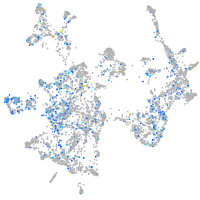
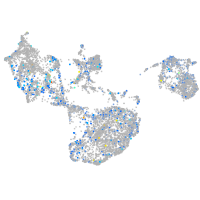
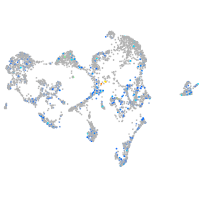
Correlated gene expression
Positive correlation
Negative correlation
Gene
r
Gene
r
LOC100535286
0.149
pvalb2
-0.060
st18
0.137
pvalb1
-0.059
BX510922.2
0.133
rbp4
-0.055
AL929457.1
0.132
marcksl1a
-0.055
si:ch211-258f14.2
0.132
cavin1b
-0.054
CU695117.1
0.129
pmp22b
-0.053
zc3h12a
0.126
fabp10a
-0.051
NC-002333.6
0.118
cebpd
-0.049
atp5mc3a
0.118
tpma
-0.048
traf4b
0.117
mylz3
-0.046
CABZ01069022.1
0.116
actc1b
-0.046
zgc:110410
0.114
tnnt3b
-0.044
mfsd4ab
0.114
cyp2ad3
-0.043
XLOC-032764
0.110
ulk2
-0.043
si:busm1-52i16.2
0.109
ppdpfb
-0.042
CABZ01048453.1
0.109
tnfsf10l
-0.042
hells
0.106
CR848667.1
-0.042
CABZ01044154.1
0.104
lrp1aa
-0.041
BX005060.1
0.102
ifitm1
-0.041
hspe1
0.101
map2k1
-0.041
si:ch211-262h13.5
0.100
dap1b
-0.041
znf972
0.100
sav1
-0.041
slc5a11
0.100
spen
-0.041
b3gnt3.1
0.099
lxn
-0.040
fam161b
0.099
gal3st2
-0.040
dad1
0.099
ak1
-0.039
slc39a14
0.097
krt15
-0.039
vcam1a
0.097
sesn1
-0.039
si:dkey-225f23.4
0.097
ebf1b
-0.039
LOC559637
0.096
tob1b
-0.039
ftr79
0.096
eif4e3
-0.039
CABZ01088229.1
0.095
tspan18a
-0.038
npm1a
0.095
chp2
-0.038
slc19a3a
0.095
zgc:153372
-0.038
snrpg
0.094
usp2b
-0.037