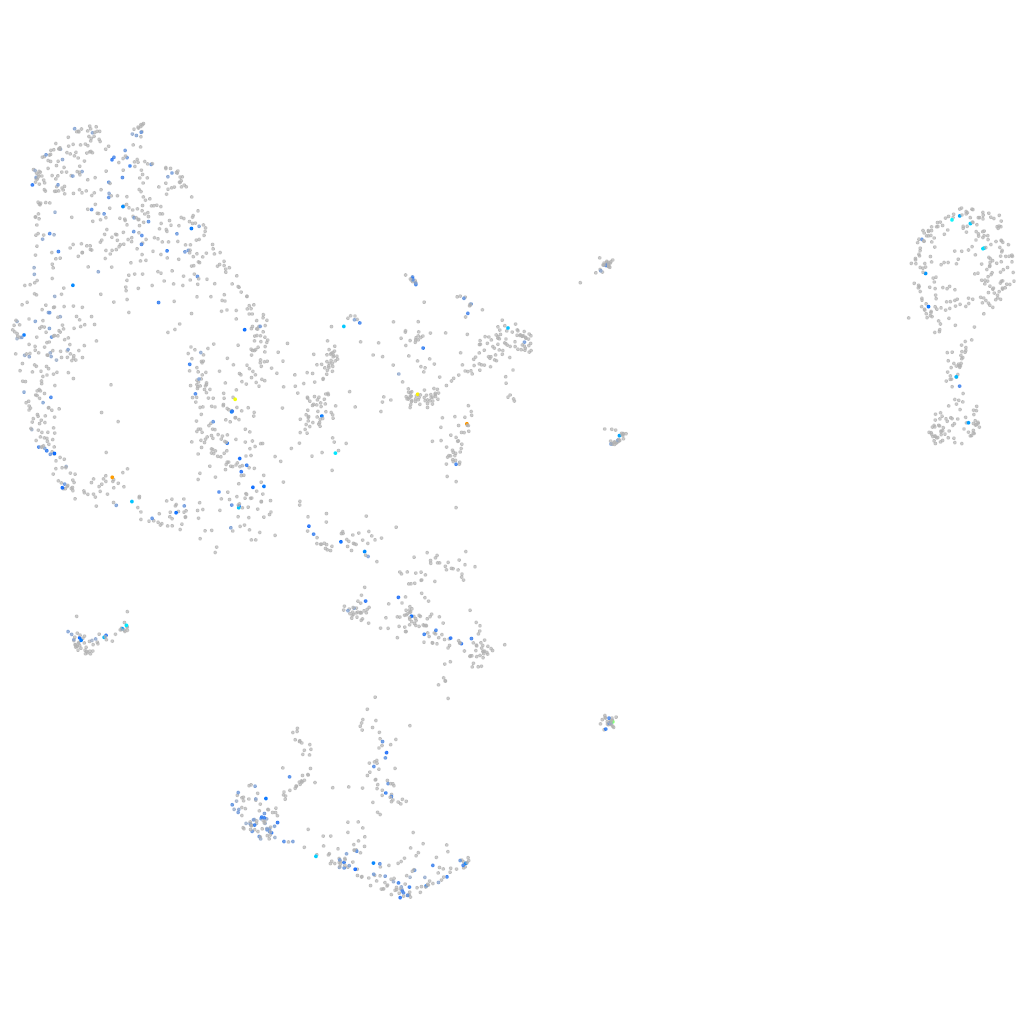
Daniocell
cltb (pronephros)
"clathrin, light chain B"
ZFIN
Gene expression UMAP
Display:
Expression
Stage
Other cell groups
all cells
blastomeres
PGCs
endoderm
axial mesoderm
muscle
mural cells /
non-skeletal muscle
mesenchyme
hematopoietic /
vasculature
pronephros
neural
spinal cord / glia
eye
taste / olfactory
otic / lateral line
epidermis
periderm
fin
ionocytes / mucous
pigment cells
Expression by stage/cluster
Correlated gene expression
Positive correlation
Negative correlation
Gene
r
Gene
r
FP016213.1
0.278
rpsa
-0.086
LOC110437771
0.255
rpl36
-0.082
TMEM132D
0.248
rpl7a
-0.082
LO018430.1
0.224
rpl23a
-0.075
si:ch211-191a16.5
0.224
fkbp1aa
-0.074
si:ch211-222k6.2
0.220
chd4a
-0.067
slitrk2
0.211
rps25
-0.063
sowahca
0.200
srsf3a
-0.061
trpc6a
0.200
actl6a
-0.061
XLOC-038013
0.192
si:ch73-281n10.2
-0.059
znf1179
0.186
nob1
-0.059
slc27a6
0.184
marcksb
-0.059
zgc:110716
0.180
lmo2
-0.058
eps8l1a
0.175
si:ch211-288g17.3
-0.057
LOC103908666
0.175
ube2g1a
-0.056
taok2b
0.174
CABZ01113954.1
-0.056
si:ch211-219a4.3
0.173
nhp2
-0.056
gsx1
0.171
rpl12
-0.056
CABZ01060373.1
0.168
skp2
-0.055
r3hdml
0.164
ddx23
-0.055
gsx2
0.161
rcor2
-0.054
mboat7
0.159
fxyd6l
-0.054
gpr37l1b
0.157
emg1
-0.053
tmcc1b
0.154
wu:fb97g03
-0.052
LOC103908877
0.153
zgc:110158
-0.052
si:ch211-214b16.3
0.149
ewsr1a
-0.052
ahr1b
0.148
nucks1a
-0.052
XLOC-043545
0.147
rpl24
-0.052
si:dkey-185m8.2
0.146
sf3b2
-0.050
asmt
0.145
top1l
-0.050
BX294379.1
0.145
pias4a
-0.050
BX511136.1
0.143
h3f3c
-0.050
gpr17
0.142
rchy1
-0.050
LOC100005923
0.142
ilf2
-0.050
si:ch211-121j5.4
0.142
tp53
-0.049