Daniocell
cica (blastomeres)
capicua transcriptional repressor a
ZFIN
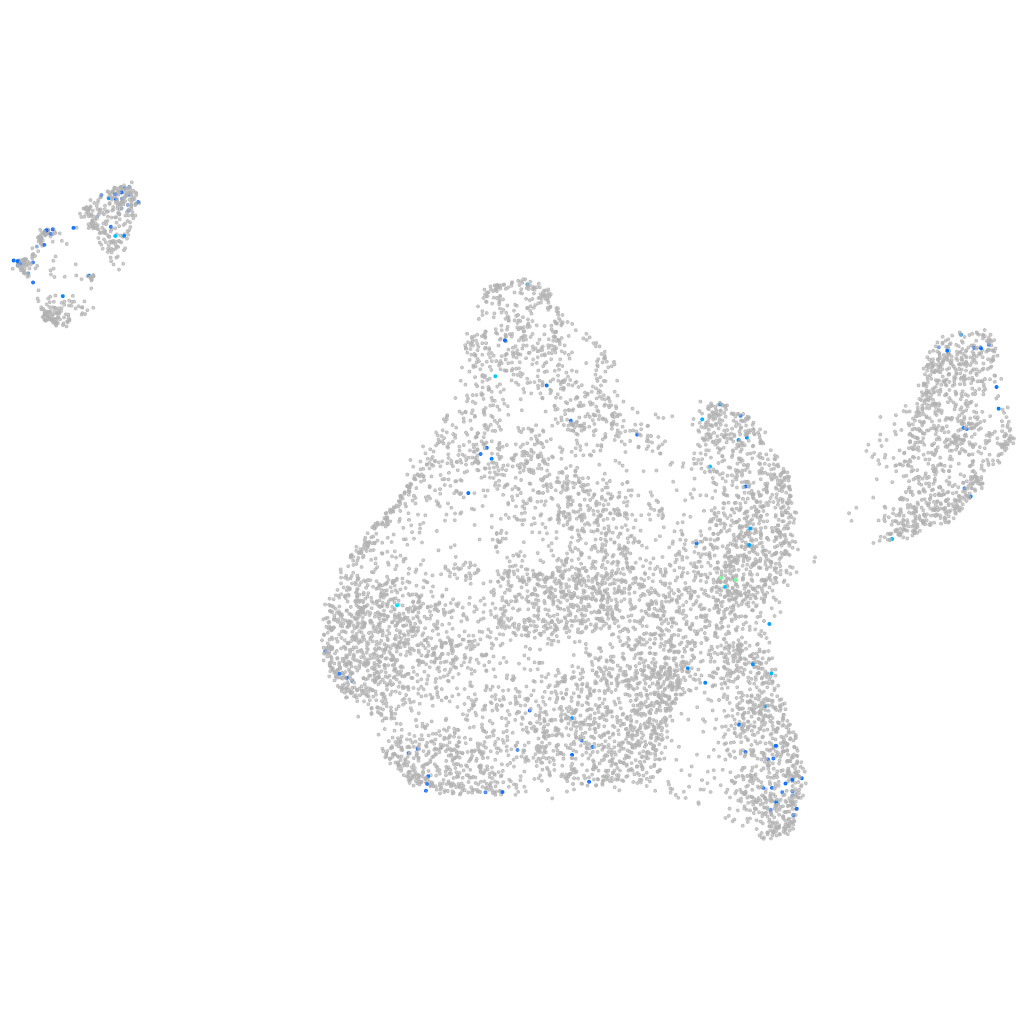
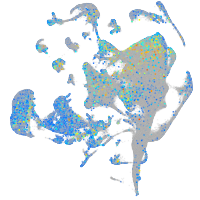
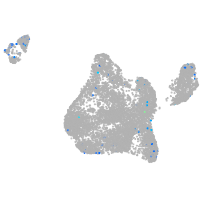
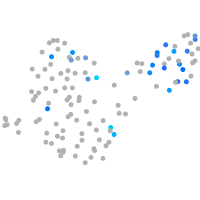
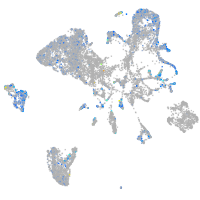
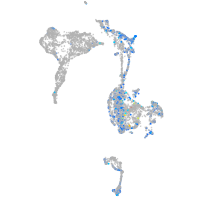
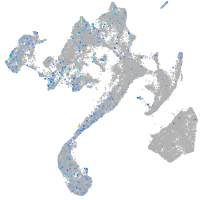
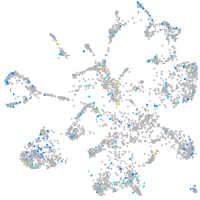
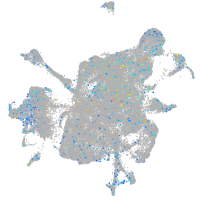
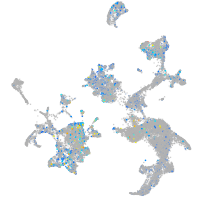
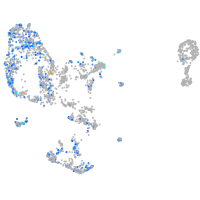
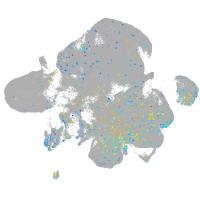
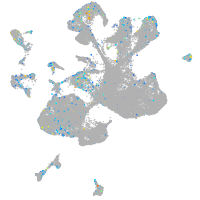
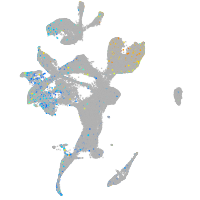
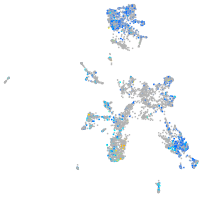
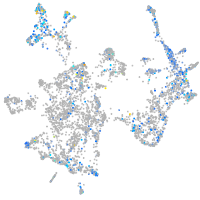
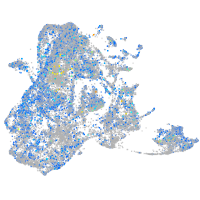
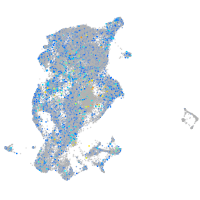
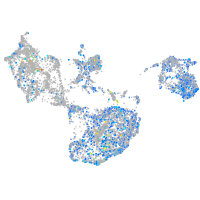
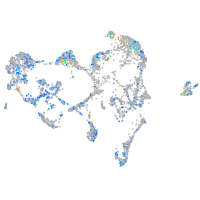
Gene expression UMAP
Display:
Expression
Stage
Other cell groups
all cells
blastomeres
PGCs
endoderm
axial mesoderm
muscle
mural cells /
non-skeletal muscle
mesenchyme
hematopoietic /
vasculature
pronephros
neural
spinal cord / glia
eye
taste / olfactory
otic / lateral line
epidermis
periderm
fin
ionocytes / mucous
pigment cells
Expression by stage/cluster
Correlated gene expression
Positive correlation
Negative correlation
Gene
r
Gene
r
si:ch211-284e13.14
0.185
marcksl1b
-0.090
ftr85
0.171
hspb1
-0.083
XLOC-042222
0.147
si:ch73-1a9.3
-0.083
LOC100536501
0.144
polr3gla
-0.079
BX255920.1
0.139
hnrnpa0b
-0.078
si:dkey-27h10.2
0.131
si:ch211-152c2.3
-0.077
si:dkey-84h14.2
0.130
CR383676.1
-0.076
si:ch211-235i11.6
0.124
eef1a1l1
-0.075
cyp27a7
0.121
hmgb2b
-0.069
mtcl1
0.116
ptmab
-0.067
EPB41L2
0.116
si:dkey-151g10.6
-0.066
abcc2
0.115
hmga1a
-0.066
XLOC-043619
0.103
srsf5a
-0.066
mvb12bb
0.098
dynll1
-0.065
mthfd1l
0.096
si:ch211-222l21.1
-0.064
LOC110438435
0.096
aldob
-0.064
zgc:195075
0.096
rps15a
-0.062
tmem198b
0.096
rpl7
-0.060
LOC101882668
0.095
stm
-0.060
mmp21
0.093
hmgn6
-0.060
eloal
0.093
rps5
-0.057
soga3a
0.089
rps7
-0.057
CU972454.5
0.089
rplp1
-0.056
XLOC-031033
0.089
khdrbs1a
-0.055
hivep2a
0.089
rpl35
-0.055
XLOC-008494
0.088
hnrnpa0a
-0.053
cdhr5a
0.087
rps12
-0.053
si:ch211-197g15.7
0.087
ybx1
-0.052
stk36
0.087
rps15
-0.052
ezrb
0.086
ccnd1
-0.052
il17rel
0.085
rpl15
-0.051
FO907110.1
0.085
rpl32
-0.051
CU915778.1
0.084
rpl21
-0.051
LOC110437970
0.084
rps24
-0.051
LOC101882290
0.084
rplp2l
-0.050