Daniocell
ciao2a (axial mesoderm)
cytosolic iron-sulfur assembly component 2A
ZFIN
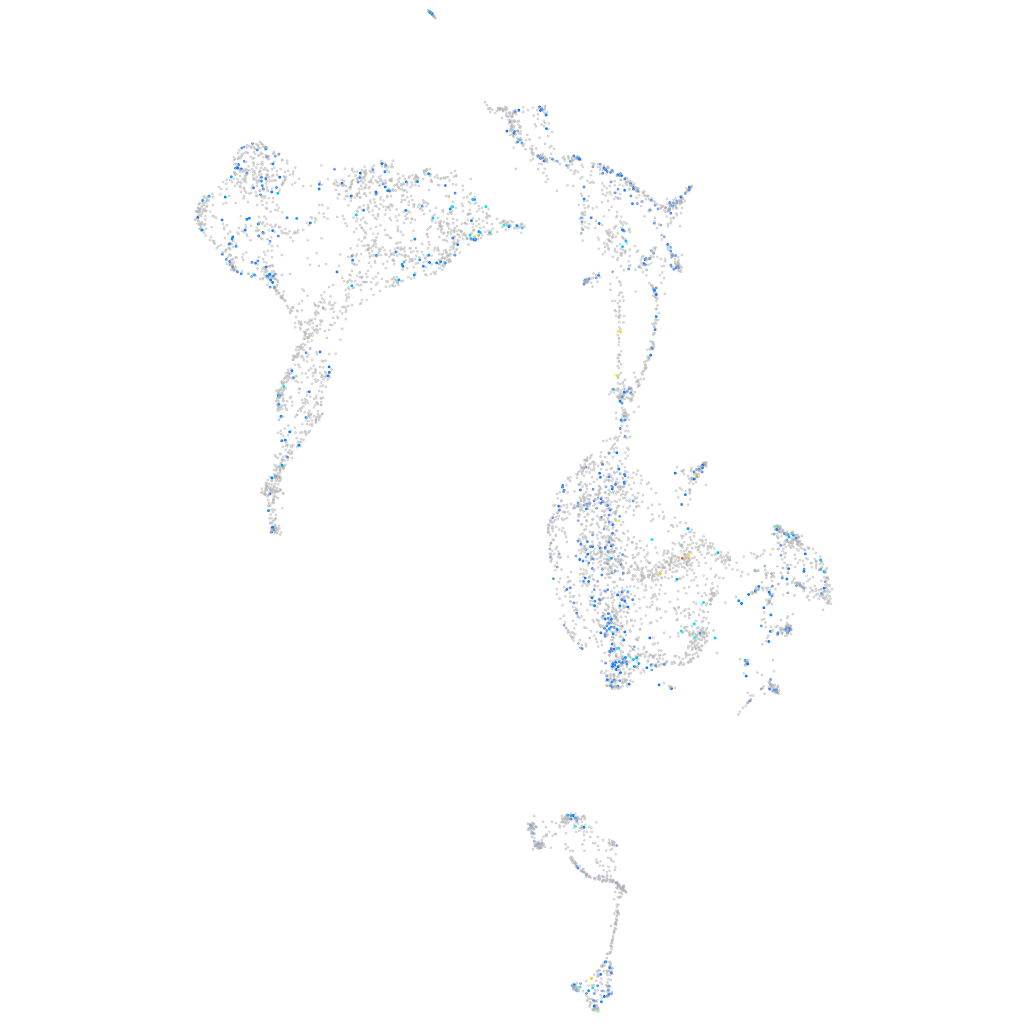
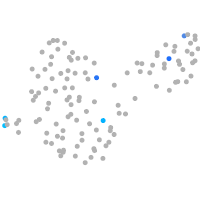
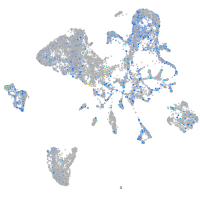
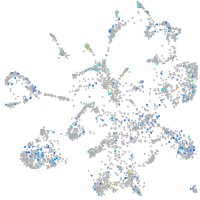
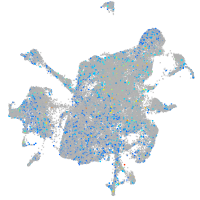
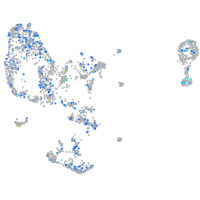
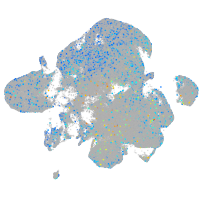
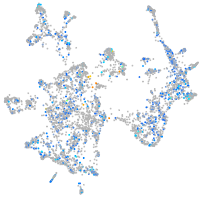
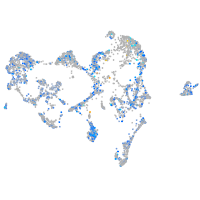
Gene expression UMAP
Display:
Expression
Stage
Other cell groups
all cells
blastomeres
PGCs
endoderm
axial mesoderm
muscle
mural cells /
non-skeletal muscle
mesenchyme
hematopoietic /
vasculature
pronephros
neural
spinal cord / glia
eye
taste / olfactory
otic / lateral line
epidermis
periderm
fin
ionocytes / mucous
pigment cells
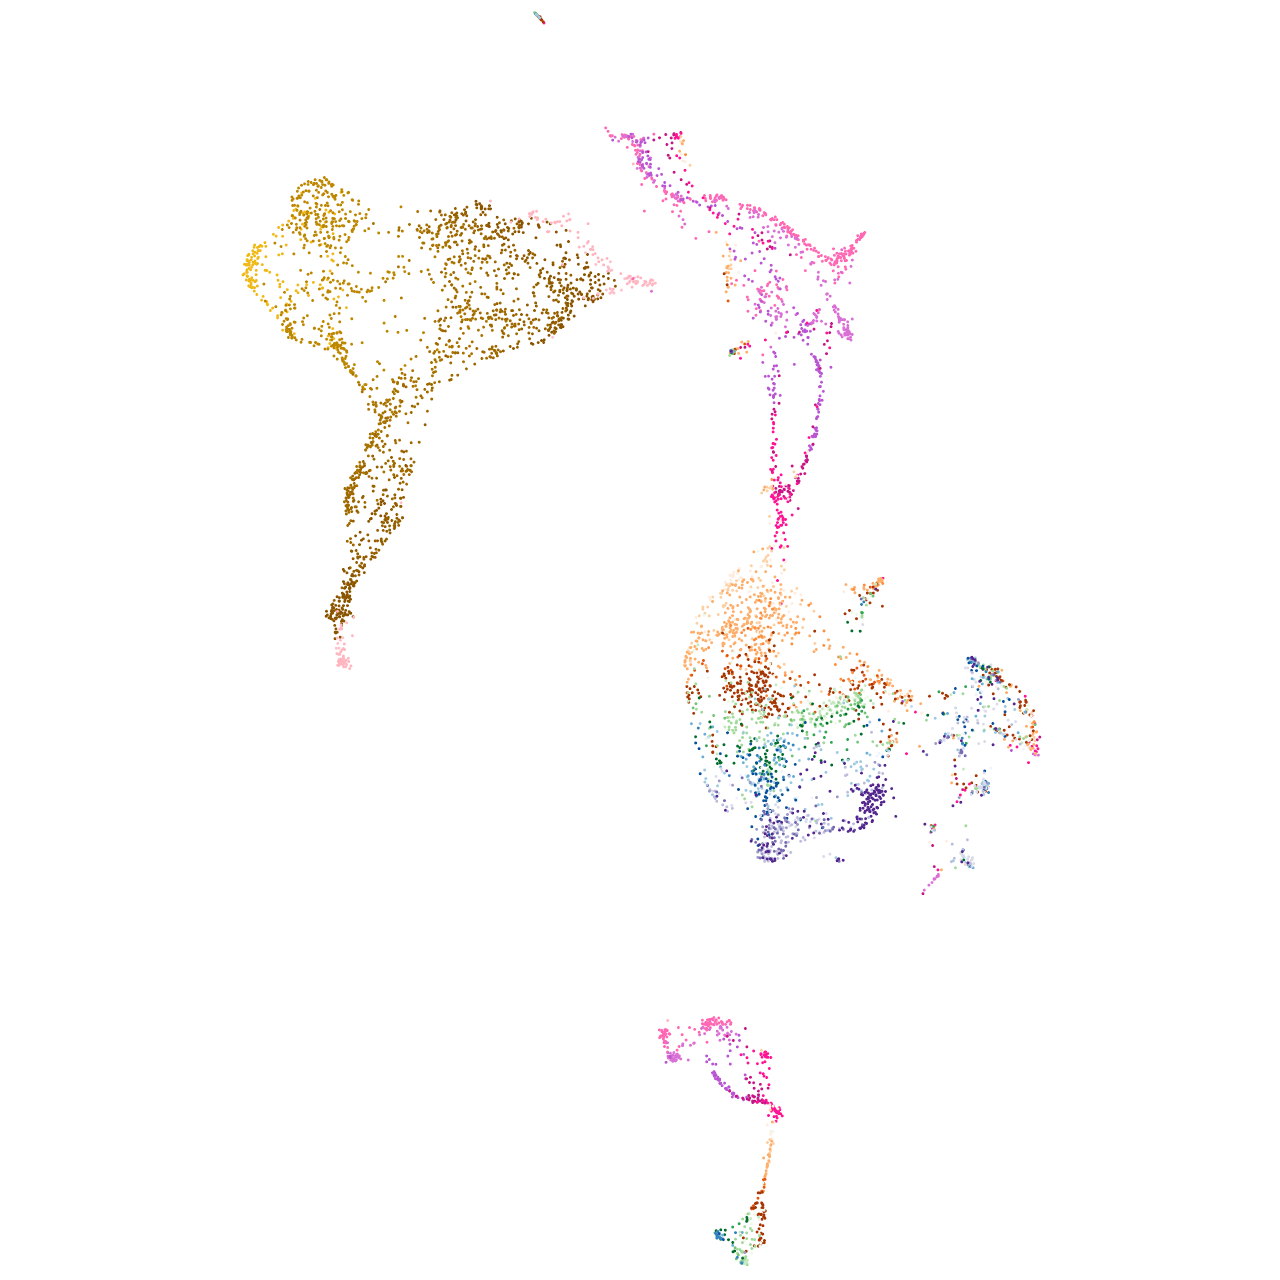
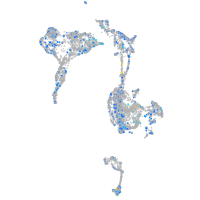
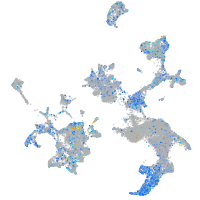
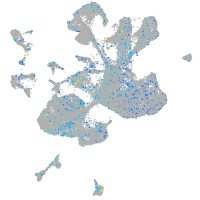
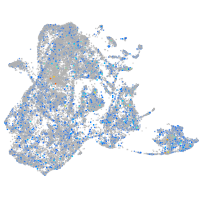
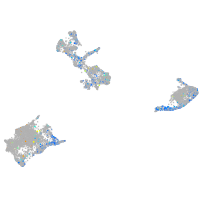
Expression by stage/cluster
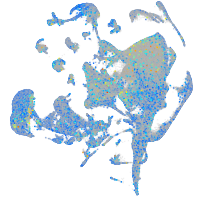
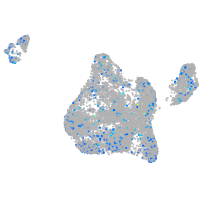
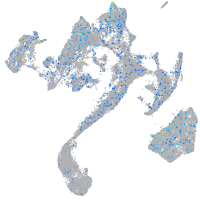
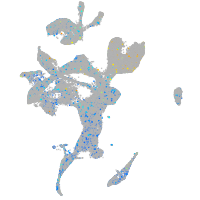
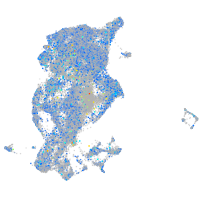
Correlated gene expression
Positive correlation
Negative correlation
Gene
r
Gene
r
CR933734.2
0.127
frzb
-0.049
LOC101885738
0.116
zgc:174153
-0.048
anxa11a
0.112
cited4b
-0.045
CU459094.3
0.112
si:dkey-239j18.2
-0.043
wdr95
0.101
klf17
-0.041
CU469514.1
0.099
NC-002333.4
-0.041
timp4.3
0.095
ndr2
-0.040
ctsz
0.093
fzd8b
-0.038
LOC101883010
0.091
zmp:0000000624
-0.038
c1qtnf6a
0.091
dennd4a
-0.037
anxa11b
0.087
CABZ01068177.1
-0.036
gria4b
0.086
six7
-0.035
fam20cb
0.085
exosc10
-0.035
gabarapb
0.084
ripply1
-0.035
nrsn1
0.083
b3gnt5b
-0.035
gcgra
0.083
si:dkeyp-2e4.3
-0.035
XLOC-009340
0.083
inhbaa
-0.035
XLOC-006345
0.083
bhlha15
-0.034
cd28l
0.083
tpx2
-0.034
si:ch211-285c6.3
0.082
acvr1bb
-0.033
tacr1b
0.082
apoc1
-0.033
si:dkey-121a11.3
0.082
prdm1a
-0.033
ppp1cbl
0.081
LOC103910363
-0.033
glud1a
0.080
six3b
-0.032
XLOC-011092
0.080
FADS6
-0.032
abcd1
0.080
stm
-0.031
atp6v1e1b
0.080
shisa2a
-0.031
chmp1b
0.080
tbx1
-0.031
gstk1
0.080
XLOC-013632
-0.031
wdr41
0.079
calr3b
-0.031
LOC100151570
0.079
ctslb
-0.031
vdac2
0.079
hnrnpm
-0.030
zgc:172339
0.079
depdc1a
-0.030
mdh2
0.078
hmmr
-0.030
CR790362.1
0.078
XLOC-016582
-0.030