Daniocell
chac2 (periderm)
"ChaC, cation transport regulator homolog 2 (E. coli)"
ZFIN
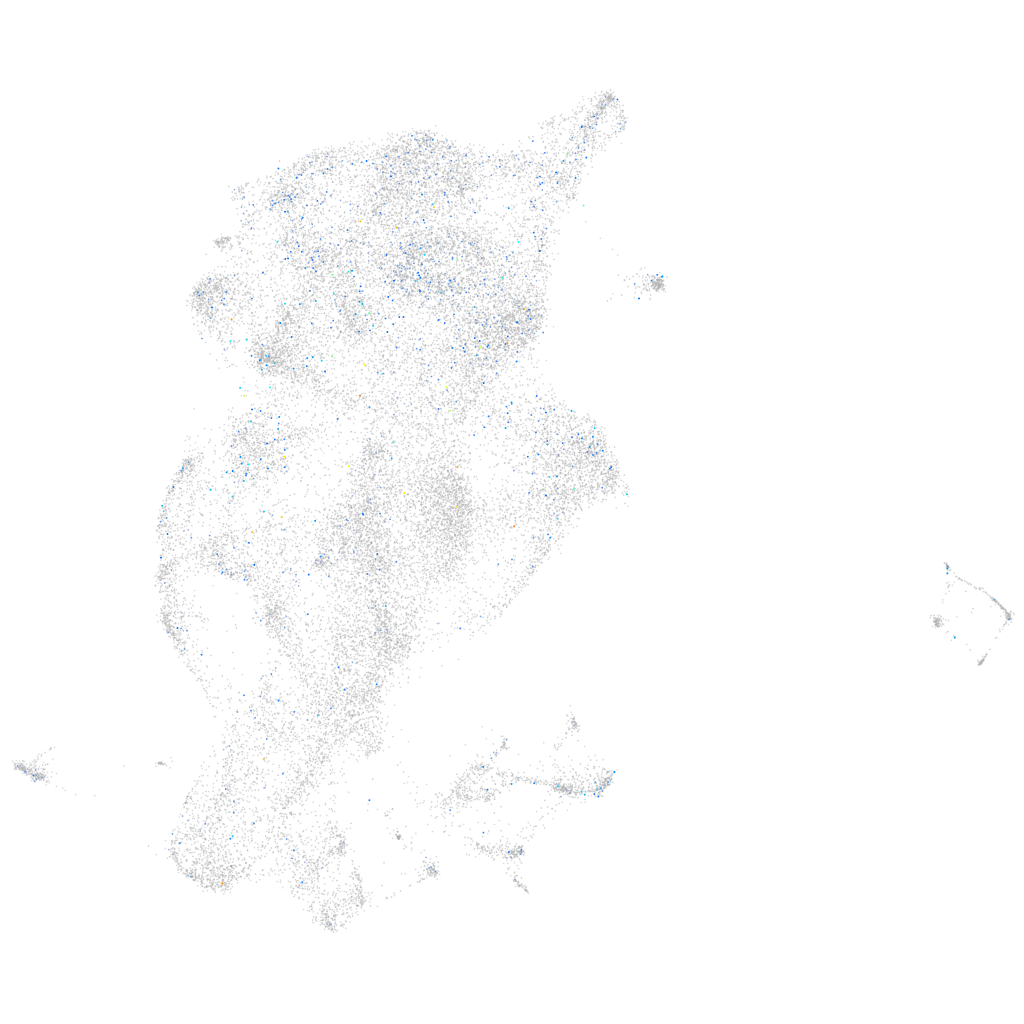
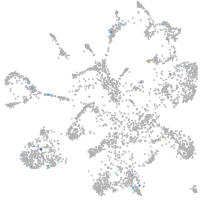
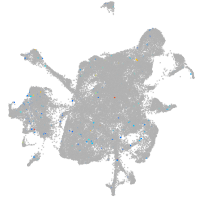
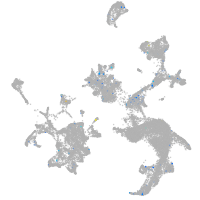
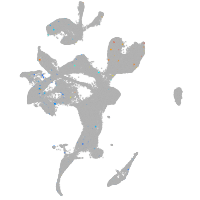
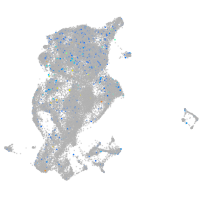
Gene expression UMAP
Display:
Expression
Stage
Other cell groups
all cells
blastomeres
PGCs
endoderm
axial mesoderm
muscle
mural cells /
non-skeletal muscle
mesenchyme
hematopoietic /
vasculature
pronephros
neural
spinal cord / glia
eye
taste / olfactory
otic / lateral line
epidermis
periderm
fin
ionocytes / mucous
pigment cells
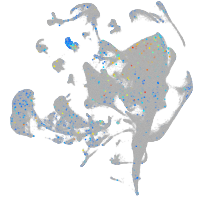
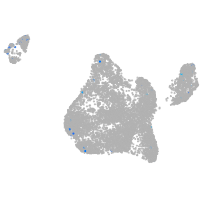
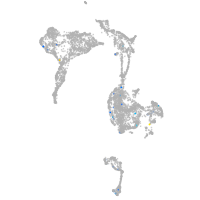
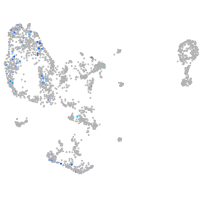
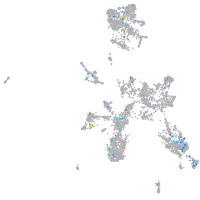
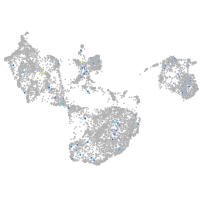
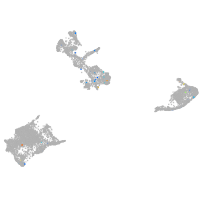
Expression by stage/cluster
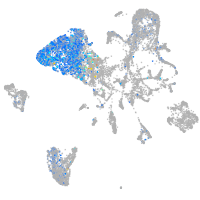
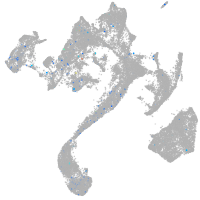
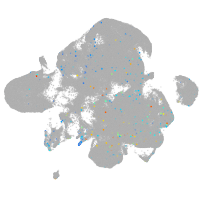
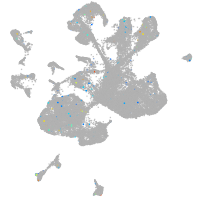
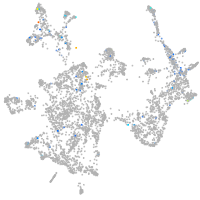
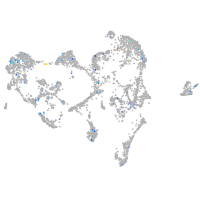
Correlated gene expression
Positive correlation
Negative correlation
Gene
r
Gene
r
defbl2
0.128
anxa1c
-0.049
ptger2a
0.083
krt92
-0.044
si:ch211-253p14.2
0.081
tmsb1
-0.044
col5a2b
0.073
tmsb4x
-0.043
XLOC-024472
0.073
ywhaz
-0.043
BX546459.1
0.073
adh8b
-0.042
si:dkey-23f9.12
0.071
icn
-0.040
ankrd6a
0.071
uraha
-0.040
mespaa
0.069
zgc:174938
-0.039
spi1a
0.068
hmga1a
-0.039
ddx58
0.066
gstp1
-0.037
si:dkey-247k7.2
0.066
osgn1
-0.034
ccr10
0.066
duox
-0.033
LOC110438512.1
0.062
capn2b
-0.033
itgb7
0.061
capn9
-0.033
BX511034.2
0.060
trim71
-0.032
LOC103912033
0.060
si:ch73-1a9.3
-0.032
BX649490.4
0.060
ANXA1 (1 of many)
-0.032
dicp3.1
0.058
evplb
-0.031
BX321870.1
0.057
zgc:110216
-0.030
LOC101885030
0.056
agr1
-0.030
XLOC-040756
0.056
gale
-0.030
LOC103909738
0.056
si:cabz01007794.1
-0.030
si:ch211-207n23.2
0.056
zgc:153665
-0.030
LOC103909323
0.056
h2afvb
-0.029
si:dkey-29m1.2
0.056
cxcl14
-0.029
tlcd1
0.055
gsnb
-0.029
si:dkeyp-75h12.7
0.055
XLOC-041945
-0.028
hspa8
0.053
alox12
-0.028
best1
0.053
krt8
-0.028
nme2b.1
0.053
sec22ba
-0.028
or115-9
0.053
hmgn2
-0.028
BX005054.1
0.052
krt4
-0.027
si:cabz01074946.1
0.052
capns1a
-0.027
b2ml
0.051
plp2
-0.027