Daniocell
cgrrf1 (muscle)
cell growth regulator with ring finger domain 1
ZFIN
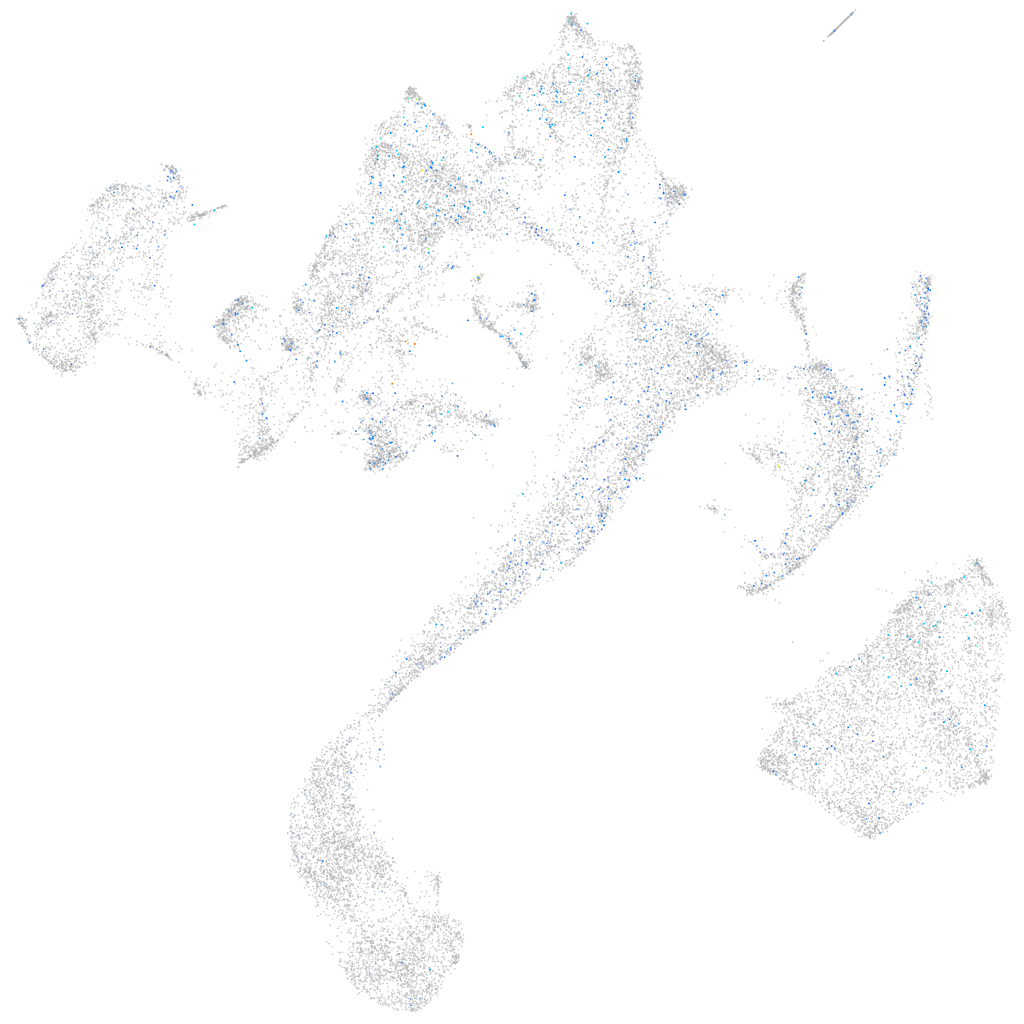
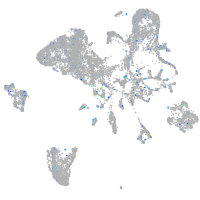
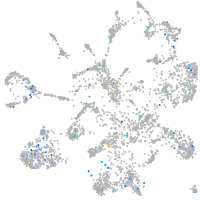
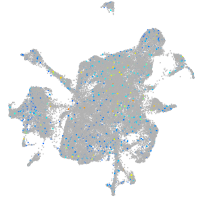
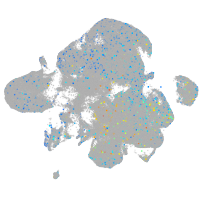
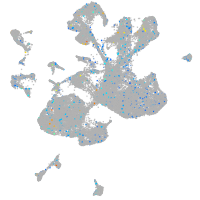
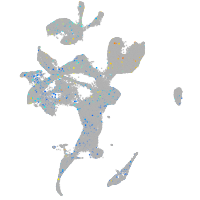
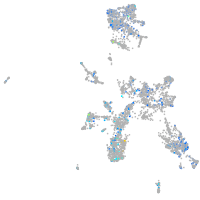
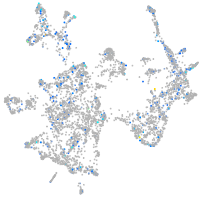
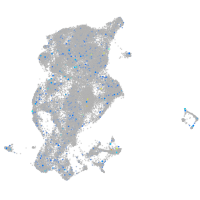
Gene expression UMAP
Display:
Expression
Stage
Other cell groups
all cells
blastomeres
PGCs
endoderm
axial mesoderm
muscle
mural cells /
non-skeletal muscle
mesenchyme
hematopoietic /
vasculature
pronephros
neural
spinal cord / glia
eye
taste / olfactory
otic / lateral line
epidermis
periderm
fin
ionocytes / mucous
pigment cells
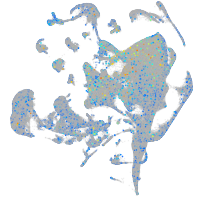
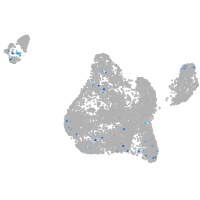
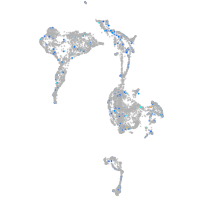
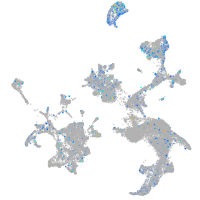
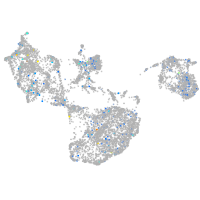
Expression by stage/cluster
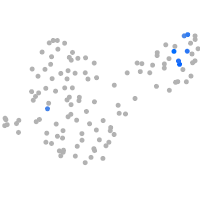
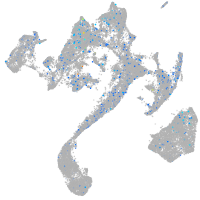
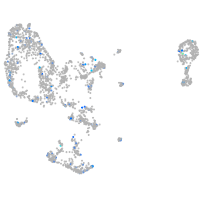
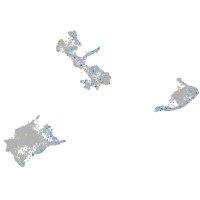
Correlated gene expression
Positive correlation
Negative correlation
Gene
r
Gene
r
LOC100537538
0.100
si:ch211-152c2.3
-0.050
sstr3
0.094
tnnt3b
-0.049
BX664750.2
0.089
XLOC-025819
-0.049
ssr3
0.069
pkmb
-0.049
CR383676.1
0.068
CABZ01061524.1
-0.048
si:ch211-212k5.1
0.068
casq1a
-0.048
ppp1r15b-2
0.067
si:ch211-255p10.3
-0.048
si:dkeyp-7a3.1
0.066
slc25a4
-0.048
cx39.4
0.066
tnni2a.4
-0.048
gnb1a
0.066
dhrs7cb
-0.047
sparc
0.066
si:ch73-367p23.2
-0.047
mdka
0.064
prx
-0.047
fstl1b
0.063
XLOC-006515
-0.046
si:ch1073-429i10.3.1
0.063
casq1b
-0.046
hnrnpa0l
0.062
CR855257.1
-0.046
bsg
0.061
myoz1b
-0.046
mfap2
0.061
XLOC-005350
-0.046
zgc:153867
0.060
atp2a1l
-0.046
zgc:92744
0.060
myom1a
-0.045
ppib
0.060
myom2a
-0.045
ier5
0.060
ryr3
-0.045
actb2
0.059
XLOC-001975
-0.045
fbn2b
0.059
pgam2
-0.045
zgc:56493
0.058
ldb3b
-0.045
marcksl1a
0.057
tmod4
-0.044
si:ch1073-44g3.1
0.057
actn3a
-0.044
rnd3a
0.057
eef2l2
-0.044
cd81a
0.057
mylpfb
-0.044
fstl1a
0.057
si:dkey-16p21.8
-0.044
flt1
0.057
ckma
-0.044
nck1a
0.056
ckmt2b
-0.043
emp2
0.056
xirp2b
-0.043
ppiab
0.055
pvalb1
-0.043
socs3b
0.055
smyd1a
-0.043
zbtb18
0.055
nme2b.2
-0.042