Daniocell
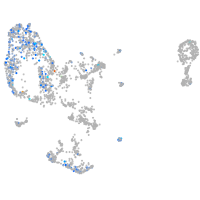
cfl2 (hematopoietic / vasculature)
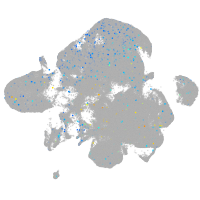
cofilin 2 (muscle)
ZFIN
Gene expression UMAP
Display:
Expression
Stage
Other cell groups
all cells
blastomeres
PGCs
endoderm
axial mesoderm
muscle
mural cells /
non-skeletal muscle
mesenchyme
hematopoietic /
vasculature
pronephros
neural
spinal cord / glia
eye
taste / olfactory
otic / lateral line
epidermis
periderm
fin
ionocytes / mucous
pigment cells
Expression by stage/cluster
Correlated gene expression
Positive correlation
Negative correlation
Gene
r
Gene
r
BX936308.2
0.096
hemgn
-0.044
XLOC-042292
0.087
gpx1a
-0.043
si:ch211-209a2.2
0.085
blvrb
-0.041
LOC108191469
0.085
hbae1.1
-0.041
si:dkey-92j16.2
0.082
hbbe1.3
-0.040
LOC795526
0.082
hbae1.3
-0.039
CU929073.1
0.077
hbae3
-0.039
CU693471.1
0.077
hbbe1.1
-0.039
LOC100536797
0.077
hbbe2
-0.038
noxa1
0.075
plac8l1
-0.038
LOC101882470
0.075
cahz
-0.037
BX321877.1
0.074
hbbe1.2
-0.037
LOC110438437
0.074
zgc:163057
-0.037
taar18d
0.074
nmt1b
-0.036
ENKD1
0.069
nt5c2l1
-0.036
myo1cb
0.069
tspo
-0.036
taar20z
0.068
tmod4
-0.036
zgc:194948
0.067
prdx2
-0.035
si:ch211-171l17.14
0.066
alas2
-0.031
col4a1
0.064
slc4a1a
-0.030
BX649349.1
0.063
klf1
-0.028
scpp1
0.062
ucp3
-0.028
spint1b
0.062
creg1
-0.028
cyb561a3b
0.062
si:ch211-207c6.2
-0.027
tmem108
0.061
epb41b
-0.027
cnn3a
0.061
wasb
-0.027
pfn2
0.061
CR293511.1
-0.027
kcnj8
0.060
slc11a2
-0.027
kdr
0.060
pabpc1b
-0.026
cd81a
0.059
laptm5
-0.026
LOC103909940
0.059
fth1a
-0.026
crygm2d1
0.059
selenoj
-0.025
calcrla
0.059
si:ch211-250g4.3
-0.025
anxa13
0.059
rac2
-0.025
XLOC-035229
0.059
zgc:56095
-0.025