Daniocell
cfap53 (hematopoietic / vasculature)
cilia and flagella associated protein 53
ZFIN
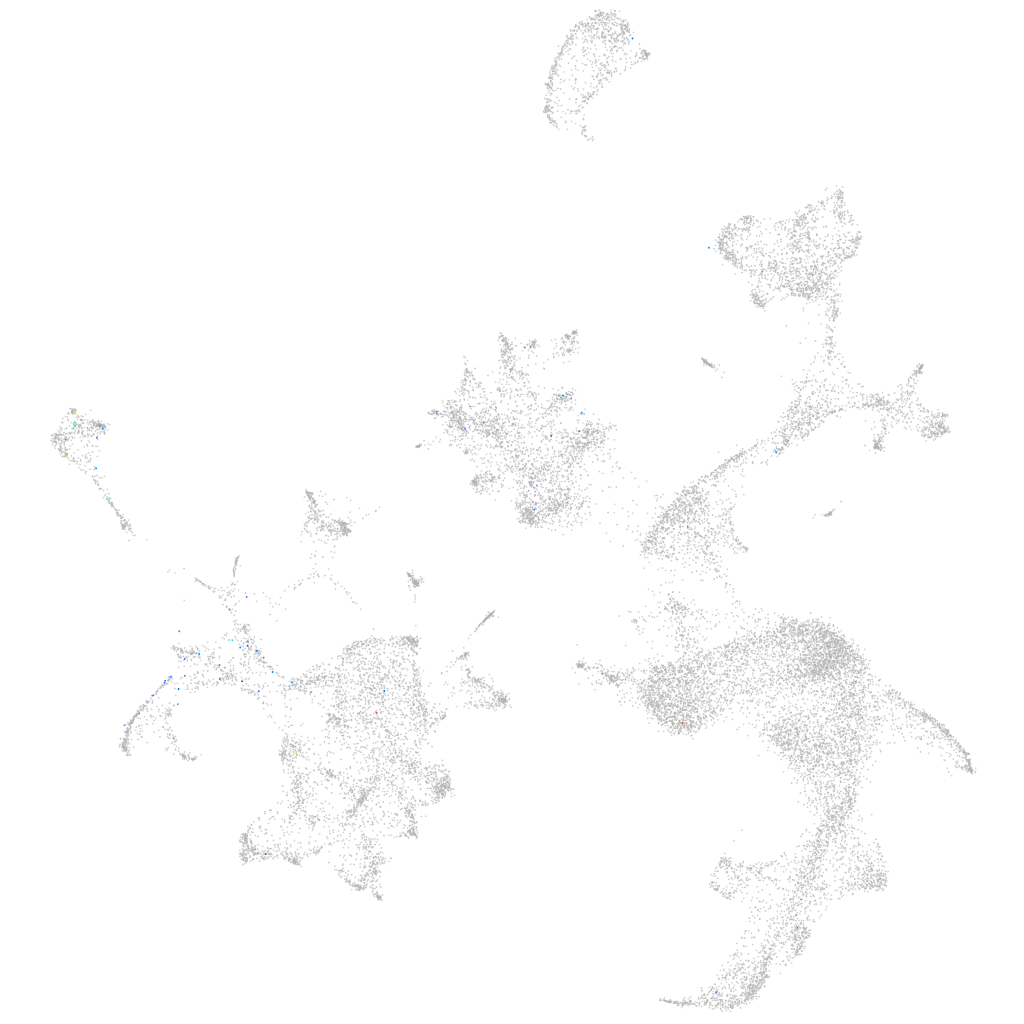
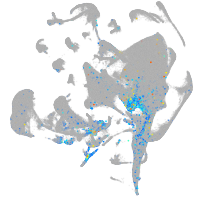
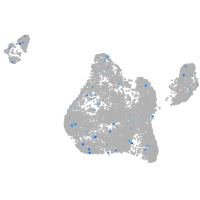
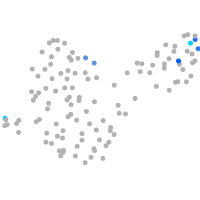
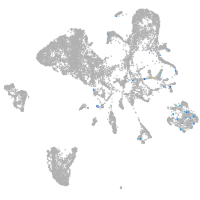
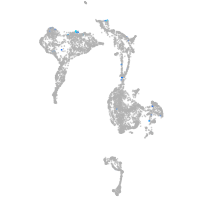
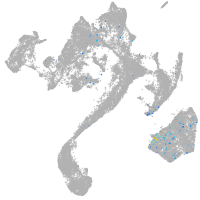
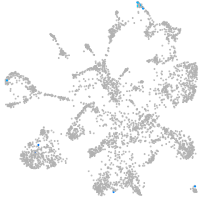
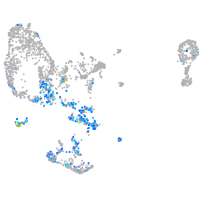
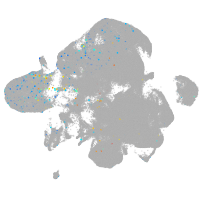
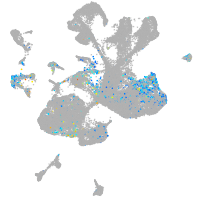
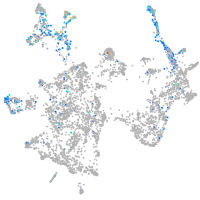
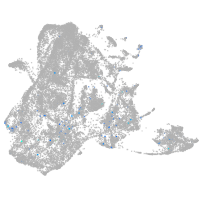
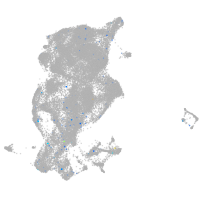
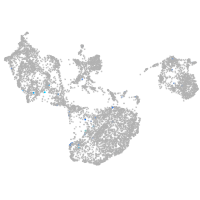
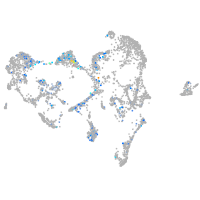
Gene expression UMAP
Display:
Expression
Stage
Other cell groups
all cells
blastomeres
PGCs
endoderm
axial mesoderm
muscle
mural cells /
non-skeletal muscle
mesenchyme
hematopoietic /
vasculature
pronephros
neural
spinal cord / glia
eye
taste / olfactory
otic / lateral line
epidermis
periderm
fin
ionocytes / mucous
pigment cells
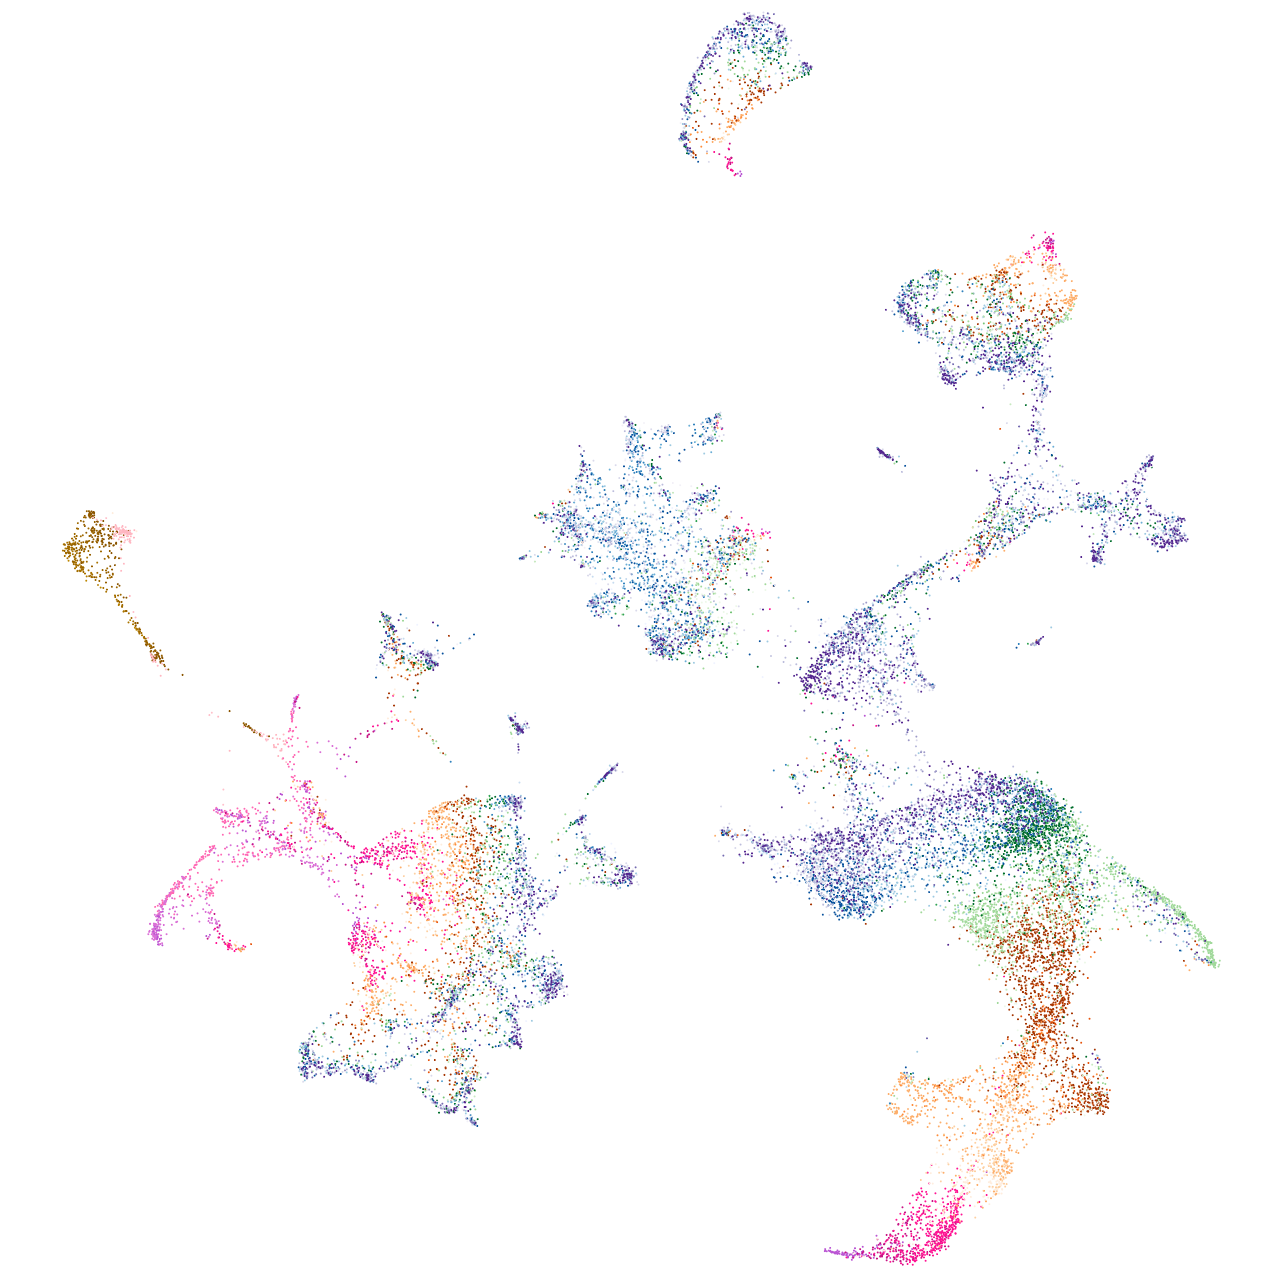
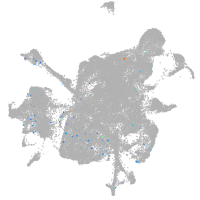
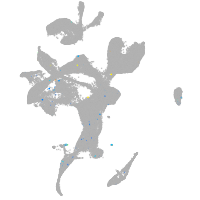
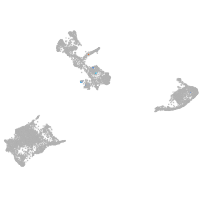
Expression by stage/cluster
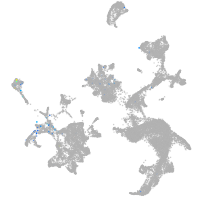
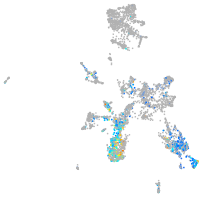
Correlated gene expression
Positive correlation
Negative correlation
Gene
r
Gene
r
pimr72
0.201
prdx2
-0.036
CABZ01002188.1
0.168
hbae1.1
-0.031
XLOC-034170
0.168
hbae3
-0.031
pih1d2
0.167
blvrb
-0.031
pih1d3
0.157
hbbe1.3
-0.031
vegfba
0.150
cahz
-0.031
XLOC-020958
0.150
hbbe1.1
-0.030
dnaaf4
0.149
mcl1a
-0.029
ccdc173
0.148
hemgn
-0.029
si:dkey-27p23.3
0.141
hbae1.3
-0.029
CR931780.1
0.141
gpx1a
-0.028
hnf1bb
0.136
tspo
-0.028
XLOC-031073
0.122
hbbe2
-0.028
LOC101886261
0.122
nt5c2l1
-0.026
FP085432.1
0.118
vdac2
-0.025
LOC101884799
0.115
nmt1b
-0.024
si:dkey-145c18.4
0.113
si:ch211-207c6.2
-0.023
si:dkey-220k22.3
0.113
selenoj
-0.023
zgc:194621
0.113
hbbe1.2
-0.022
itga11b
0.111
zgc:163057
-0.022
rab36
0.110
plac8l1
-0.022
ttc25
0.106
alas2
-0.021
ribc2
0.104
pvalb1
-0.021
pimr140
0.103
slc4a1a
-0.021
CABZ01005857.2
0.103
h1fx
-0.021
XLOC-037017
0.101
ccni
-0.021
LOC100149931
0.100
tmem14ca
-0.020
shank2
0.100
creg1
-0.020
BX548000.1
0.100
si:ch211-227m13.1
-0.020
spag16
0.099
tmod4
-0.020
LOC110437883
0.098
gabarapa
-0.020
efcab1
0.098
pvalb2
-0.019
LOC110437842
0.097
hbae5
-0.019
daw1
0.097
atp5if1b
-0.019
styxl1
0.097
si:ch211-250g4.3
-0.018