Daniocell
cfap100 (ionocytes / mucous-producing)
cilia and flagella associated protein 100
ZFIN
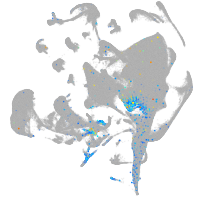
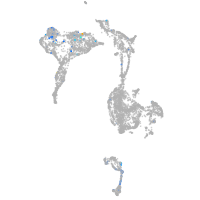
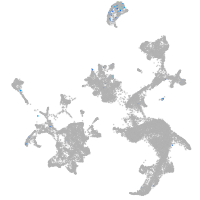
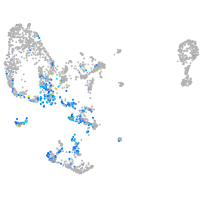
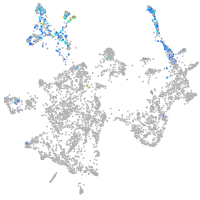
Gene expression UMAP
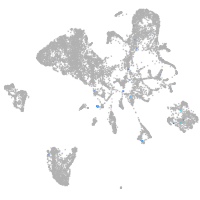
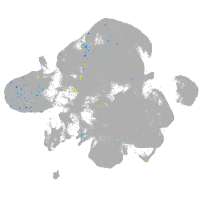
Display:
Expression
Stage
Other cell groups
all cells
blastomeres
PGCs
endoderm
axial mesoderm
muscle
mural cells /
non-skeletal muscle
mesenchyme
hematopoietic /
vasculature
pronephros
neural
spinal cord / glia
eye
taste / olfactory
otic / lateral line
epidermis
periderm
fin
ionocytes / mucous
pigment cells
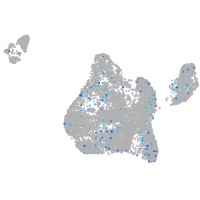
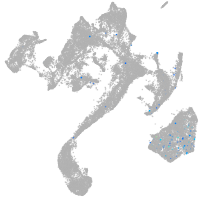
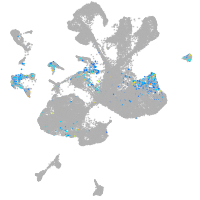
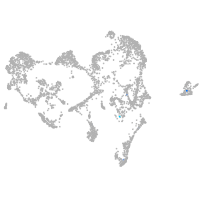
Expression by stage/cluster
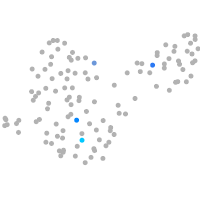
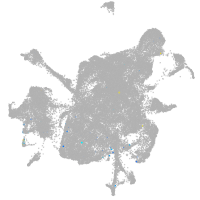
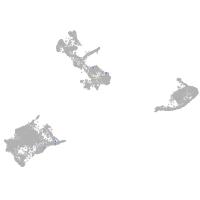
Correlated gene expression
Positive correlation
Negative correlation
Gene
r
Gene
r
ccdc175
0.802
si:dkey-87o1.2
-0.041
LOC100536937
0.802
f11r.1
-0.039
znf1166
0.802
icn2
-0.035
CU550719.2
0.802
wu:fb18f06
-0.034
si:dkey-222b8.4
0.769
phlda2
-0.034
dnaaf3l
0.762
si:ch73-347e22.8
-0.033
lrguk
0.742
romo1
-0.033
CU633857.1
0.709
ndufa5
-0.033
wdr27
0.684
prr13
-0.033
si:ch1073-181h11.2
0.668
s100v2
-0.032
si:dkeyp-86c4.1
0.657
chmp2bb
-0.032
rsph3
0.647
cldn7b
-0.032
cfap300
0.643
gbgt1l4
-0.032
c18h15orf65
0.608
BX000438.2
-0.031
got1l1
0.594
chmp1b
-0.031
drc1
0.591
ndufa4l
-0.031
spata18
0.582
hdlbpa
-0.030
CR855277.2
0.566
ndufb10
-0.030
mustn1a
0.565
cd63
-0.030
lrrc51
0.562
uqcrq
-0.030
dnali1
0.518
ctsla
-0.030
tbata
0.505
atp1b1b
-0.029
znf1016
0.502
si:dkey-112e7.2
-0.029
ccdc146
0.498
eif3d
-0.029
ccdc13
0.492
atf4a
-0.029
si:dkeyp-69c1.9
0.487
arf2b
-0.028
nme5
0.471
aldob
-0.028
katnal2
0.456
tmem59
-0.028
tekt1
0.450
ost4
-0.027
foxj1b
0.444
tmed2
-0.027
dnaaf4
0.443
ndufa3
-0.027
si:dkey-56m15.5
0.443
fuca1.1
-0.027
ugt5g2
0.443
si:dkey-248g15.3
-0.027
si:dkey-163f12.6
0.439
zgc:193505
-0.027
cd37
0.431
eif2s1b
-0.027