Daniocell
celsr2 (muscle)
"cadherin, EGF LAG seven-pass G-type receptor 2"
ZFIN
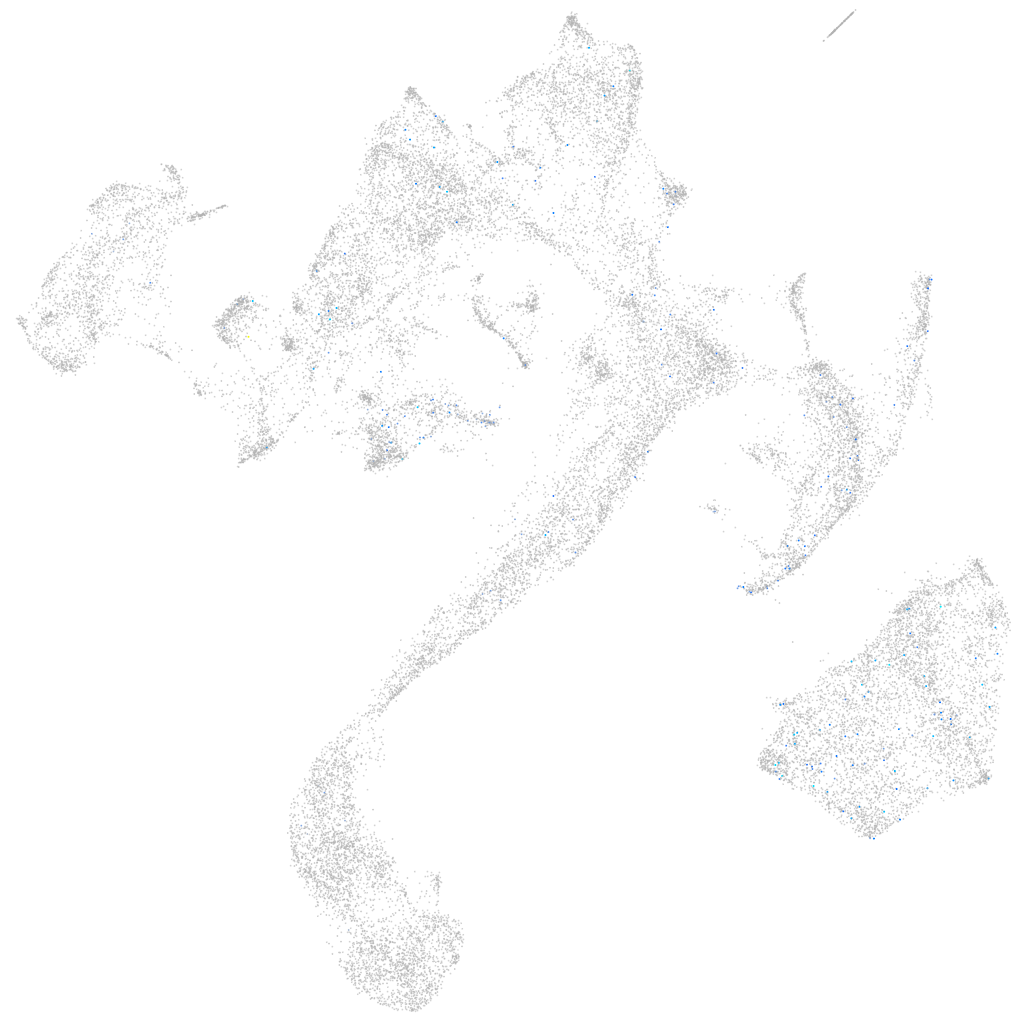
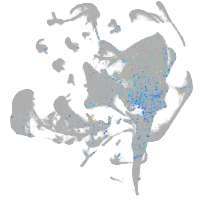
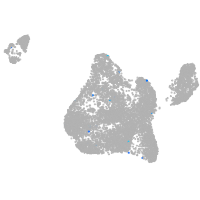
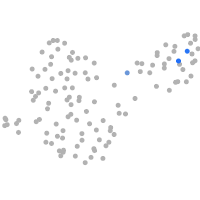
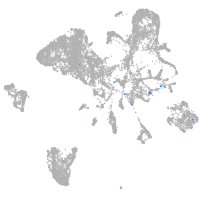
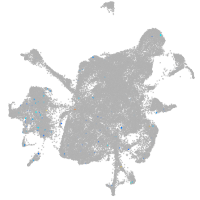
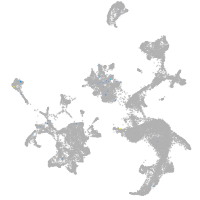
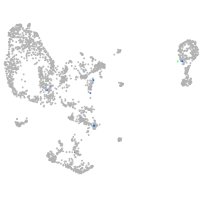
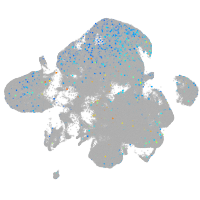
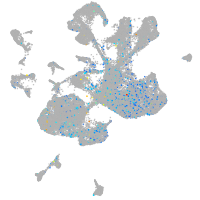
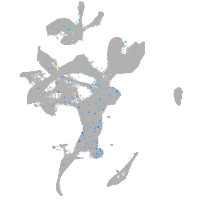
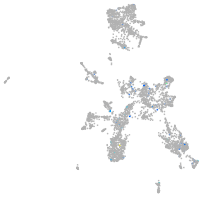
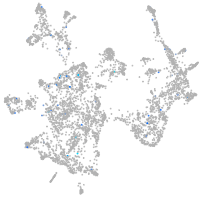
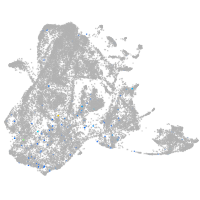
Gene expression UMAP
Display:
Expression
Stage
Other cell groups
all cells
blastomeres
PGCs
endoderm
axial mesoderm
muscle
mural cells /
non-skeletal muscle
mesenchyme
hematopoietic /
vasculature
pronephros
neural
spinal cord / glia
eye
taste / olfactory
otic / lateral line
epidermis
periderm
fin
ionocytes / mucous
pigment cells
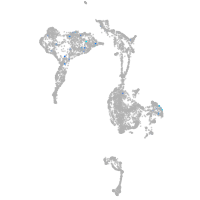
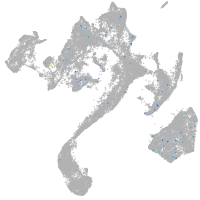
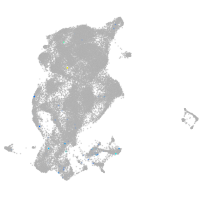
Expression by stage/cluster
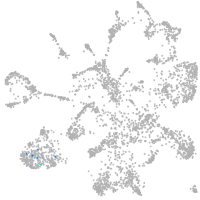
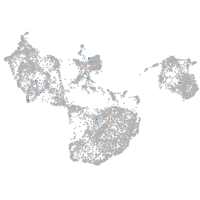
Correlated gene expression
Positive correlation
Negative correlation
Gene
r
Gene
r
BX890551.1
0.107
rpl37
-0.042
or125-3
0.094
zgc:114188
-0.039
LOC110438226
0.090
ttn.1
-0.039
CR293509.1
0.090
rps10
-0.039
si:dkey-222h21.1
0.090
actc1b
-0.039
LOC110439543
0.086
atp5meb
-0.037
BX842700.1
0.085
ttn.2
-0.037
LOC101885940
0.084
ckma
-0.036
CABZ01023255.1
0.080
atp2a1
-0.036
si:dkey-16n15.6
0.080
aldoab
-0.036
si:dkey-206f10.1
0.079
eno1a
-0.036
ssuh2.3
0.078
ldb3b
-0.036
RBP1 (1 of many)
0.075
tnnc2
-0.035
CU694808.1
0.075
ldb3a
-0.035
spi1a
0.072
atp5f1b
-0.035
si:dkey-33c12.12
0.070
acta1b
-0.035
LOC100535838
0.070
tpma
-0.035
CU633978.1
0.069
neb
-0.034
si:ch211-77g15.32
0.068
pabpc4
-0.034
XLOC-008734
0.068
mybphb
-0.034
sox19a
0.064
nme2b.2
-0.034
LOC101884186
0.064
suclg1
-0.034
si:dkey-3h2.3
0.063
ak1
-0.034
igl4v8
0.062
mylpfa
-0.034
pthlhb
0.062
si:ch211-266g18.10
-0.034
cd40lg
0.062
tmem38a
-0.034
znf998
0.062
actn3b
-0.034
CT573139.1
0.061
ckmb
-0.033
LOC101882515
0.061
vdac2
-0.033
BX664610.1
0.060
mt-nd1
-0.033
zmp:0000001172
0.060
rps17
-0.033
XLOC-008693
0.058
atp5mc3b
-0.033
psmb11b
0.058
si:ch73-367p23.2
-0.033
clrn3
0.057
mylz3
-0.033
si:dkey-112a7.5
0.057
srl
-0.033