Daniocell
ccr11.1 (fin)
chemokine (C-C motif) receptor 11.1
ZFIN
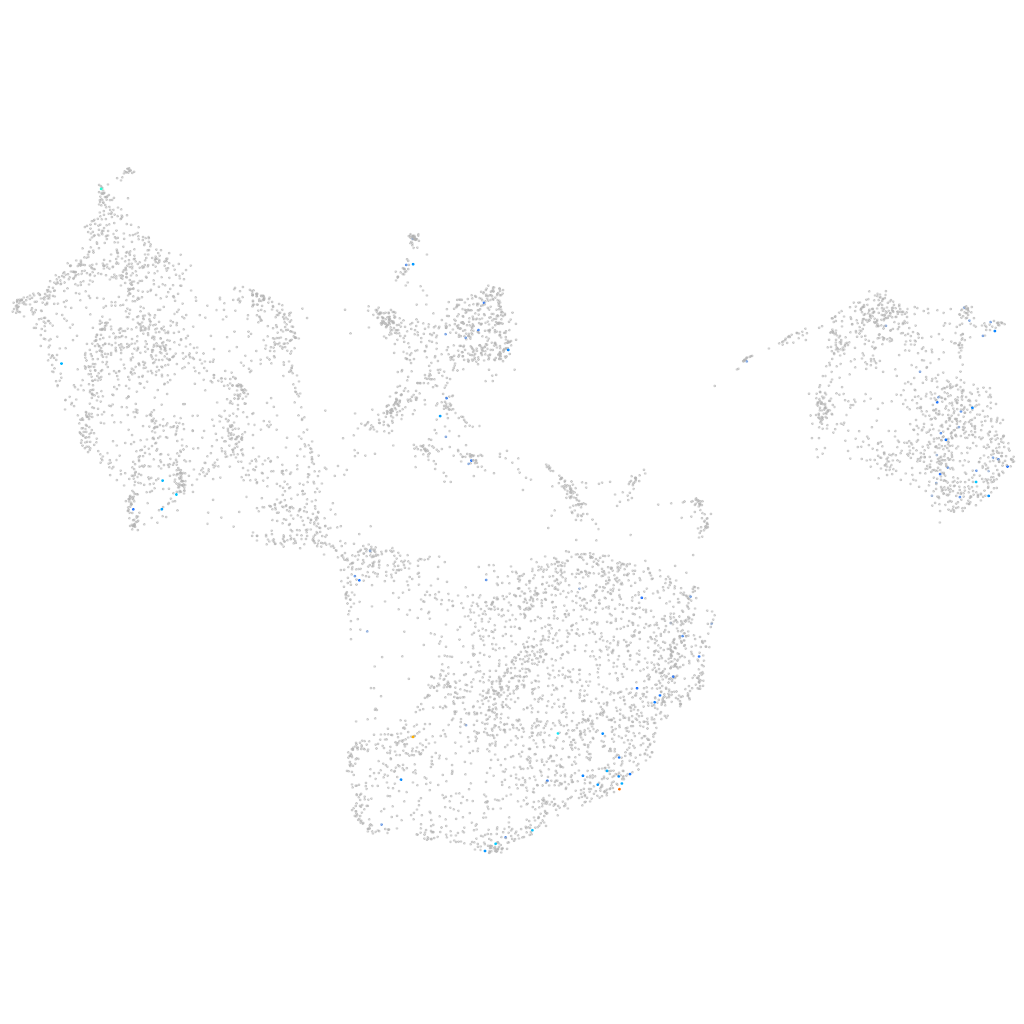
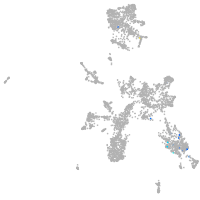
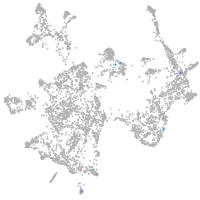
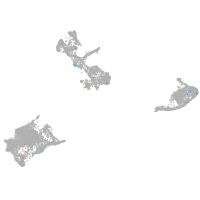
Gene expression UMAP
Display:
Expression
Stage
Other cell groups
all cells
blastomeres
PGCs
endoderm
axial mesoderm
muscle
mural cells /
non-skeletal muscle
mesenchyme
hematopoietic /
vasculature
pronephros
neural
spinal cord / glia
eye
taste / olfactory
otic / lateral line
epidermis
periderm
fin
ionocytes / mucous
pigment cells
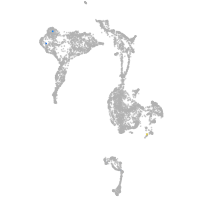
Expression by stage/cluster
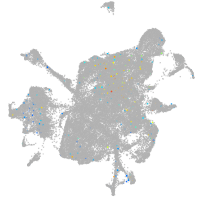
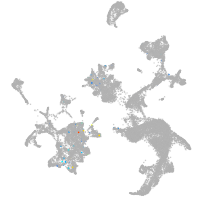
Correlated gene expression
Positive correlation
Negative correlation
Gene
r
Gene
r
XLOC-005276
0.199
si:ch73-1a9.3
-0.052
si:dkey-16p6.1
0.168
rplp2l
-0.048
LOC101883516
0.159
rps29
-0.046
si:dkeyp-100a5.4
0.153
si:dkey-151g10.6
-0.041
pigq
0.141
si:ch73-281n10.2
-0.037
CR769769.1
0.141
rpl36
-0.037
sox10
0.137
hpdb
-0.036
acsl3a
0.130
prdx1
-0.035
CU182107.1
0.130
pcbd1
-0.035
si:ch211-277c7.7
0.129
pah
-0.035
si:ch211-194e18.2
0.128
rpl8
-0.035
smtnb
0.127
stmn1a
-0.034
LOC110439422.1
0.125
hmga1a
-0.033
si:ch211-243o19.4
0.122
acy3.2
-0.033
galnt16
0.121
fam169ab
-0.032
ap4e1
0.117
qdpra
-0.032
arap1
0.113
rpl38
-0.032
mfsd12a
0.112
NC-002333.17
-0.032
LOC108180102
0.112
bhmt
-0.031
znf1033
0.110
c1qtnf5
-0.031
gb:eh456644
0.109
gpc1a
-0.030
hcrtr2
0.106
snrpd1
-0.030
LOC110439953
0.103
gstz1
-0.030
si:dkey-57k2.6
0.102
hgd
-0.030
LOC103911173
0.102
fbln1
-0.029
XLOC-029661
0.102
zic2a
-0.029
btr26
0.100
myca
-0.029
si:ch73-378g22.1
0.100
inka1b
-0.029
fthl28
0.099
nucks1a
-0.028
LOC103909978
0.099
cmtm3
-0.028
LOC110439905
0.099
ttc36
-0.028
en2a
0.096
prrx1b
-0.028
LOC100537853
0.094
ucp1
-0.028
BX470211.1
0.093
si:ch211-76l23.4
-0.028
zgc:101663
0.093
rpl29
-0.027