Daniocell
catip (periderm)
ciliogenesis associated TTC17 interacting protein
ZFIN
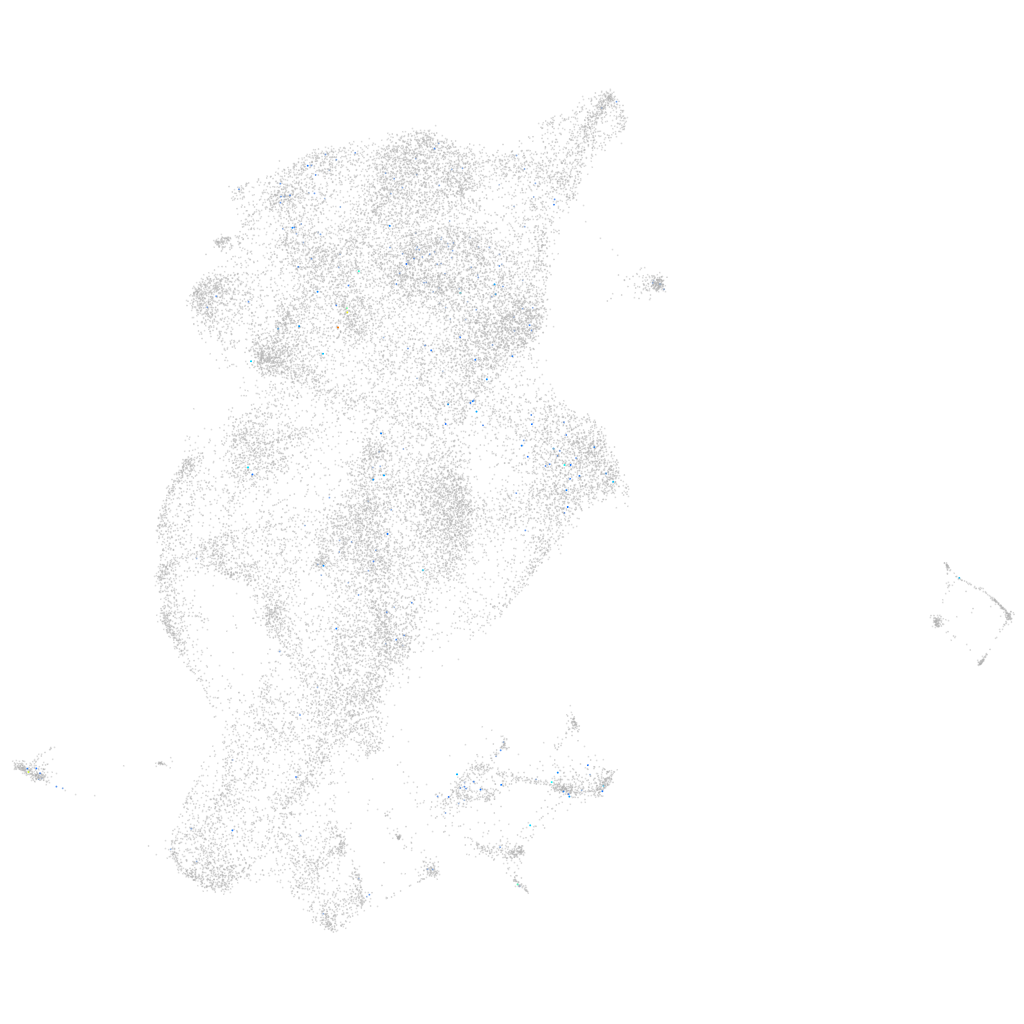
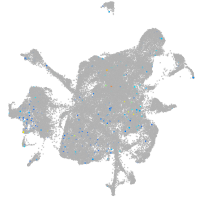
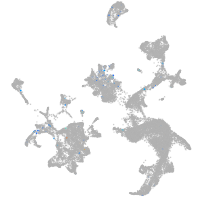
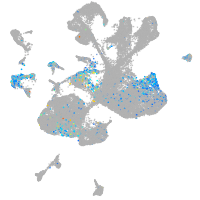
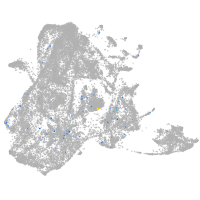
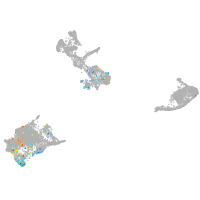
Gene expression UMAP
Display:
Expression
Stage
Other cell groups
all cells
blastomeres
PGCs
endoderm
axial mesoderm
muscle
mural cells /
non-skeletal muscle
mesenchyme
hematopoietic /
vasculature
pronephros
neural
spinal cord / glia
eye
taste / olfactory
otic / lateral line
epidermis
periderm
fin
ionocytes / mucous
pigment cells
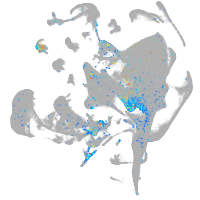
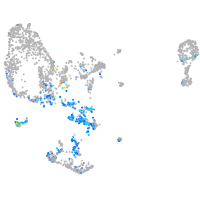
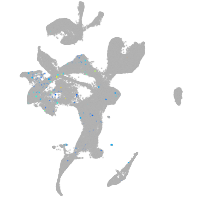
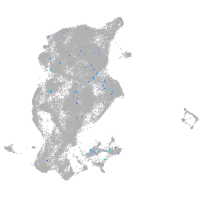
Expression by stage/cluster
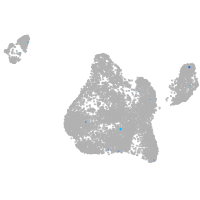
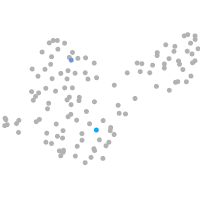
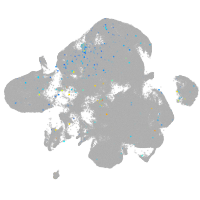
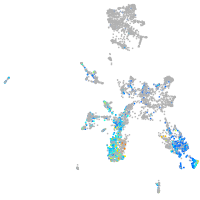
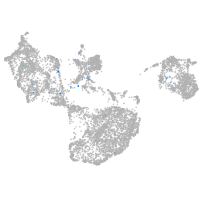
Correlated gene expression
Positive correlation
Negative correlation
Gene
r
Gene
r
pcdh15b
0.212
cyt1l
-0.028
XLOC-034373
0.172
agr1
-0.025
cryabb
0.159
cyt1
-0.023
CR848715.1
0.155
cst14b.1
-0.023
LOC108179803
0.154
homer2
-0.022
CR385050.3
0.134
wu:fb18f06
-0.021
FO704673.1
0.124
krt4
-0.021
CR931782.1
0.124
anxa1c
-0.021
CR855311.5
0.124
krt92
-0.020
moto
0.121
uraha
-0.020
si:dkeyp-82b4.3
0.121
CABZ01078055.1
-0.018
pomca
0.120
cxcl14
-0.018
TMEM132D
0.115
ckap4
-0.018
slc6a4b
0.110
pmm2
-0.017
csf1ra
0.106
ywhaz
-0.017
LOC103910269
0.104
zgc:174938
-0.017
agbl2
0.099
ARF5 (1 of many)
-0.017
XLOC-020238
0.097
si:dkey-9l20.3
-0.017
CR354564.1
0.096
TSTA3 (1 of many)
-0.017
tmprss12
0.096
sec61a1
-0.016
ccdc65
0.095
ssr4
-0.016
LOC110440219
0.092
adh8b
-0.015
ccdc149a
0.092
kdelr3
-0.015
CU929444.1
0.091
mvp
-0.015
si:ch1073-280e3.1
0.088
cbsb
-0.015
LOC110439434
0.087
mgst2
-0.015
kif17
0.087
osgn1
-0.015
LOC103910840
0.086
arid3c
-0.015
si:dkey-1h4.4
0.084
acer1
-0.015
BX682557.2
0.082
rab11fip1b
-0.015
LOC795897
0.081
slc39a11
-0.014
chrnb4
0.081
cdh26.1
-0.014
XLOC-022550
0.079
stau2
-0.014
XLOC-035194
0.079
bicdl2
-0.014
CU469524.2
0.078
alox12
-0.014