cytosolic arginine sensor for mTORC1 subunit 2
ZFIN 
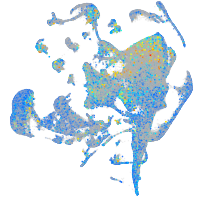
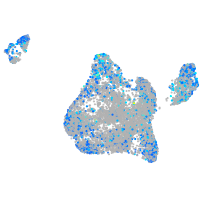
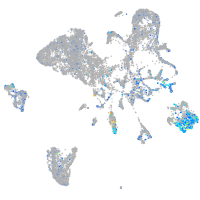
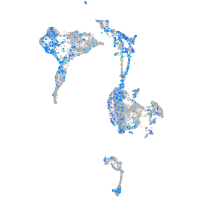
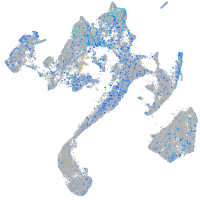
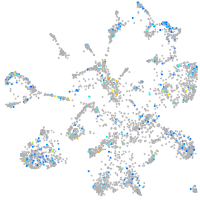
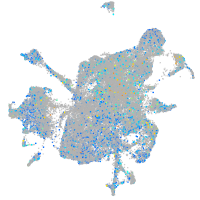
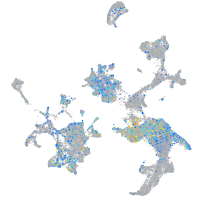
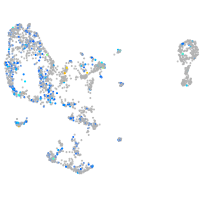
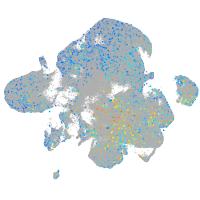
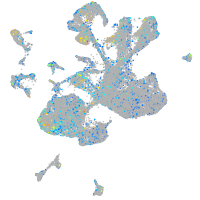
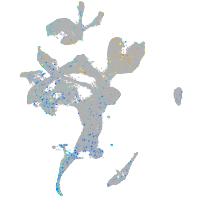
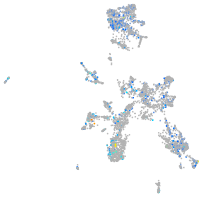
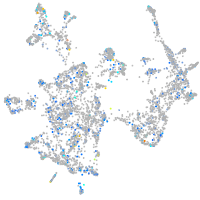
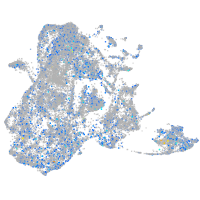
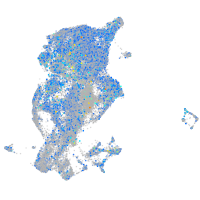
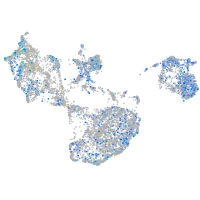
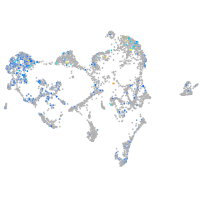
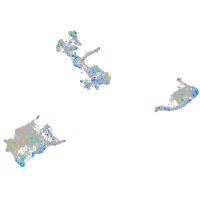
Expression by stage/cluster


Correlated gene expression


| Positive correlation | Negative correlation | ||
| Gene | r | Gene | r |
| cd63 | 0.089 | rps29 | -0.082 |
| btg2 | 0.084 | rplp2l | -0.078 |
| selenow1 | 0.081 | rpl38 | -0.076 |
| mcl1a | 0.081 | rplp1 | -0.073 |
| tmem59 | 0.080 | rpl29 | -0.072 |
| si:ch211-260e23.9 | 0.077 | si:dkey-151g10.6 | -0.071 |
| ctsla | 0.077 | rpl37 | -0.070 |
| ppdpfb | 0.076 | rpl39 | -0.065 |
| nupr1a | 0.076 | rps12 | -0.063 |
| cd9b | 0.076 | rps28 | -0.060 |
| spint2 | 0.075 | rpl35a | -0.053 |
| mid1ip1a | 0.073 | stmn1a | -0.051 |
| zgc:111983 | 0.070 | pabpc1a | -0.049 |
| eif1b | 0.070 | rps21 | -0.048 |
| mhc1zba | 0.069 | rpl36 | -0.048 |
| ccng2 | 0.068 | tmsb4x | -0.043 |
| zgc:92606 | 0.068 | rpl31 | -0.042 |
| dhrs13a.2 | 0.067 | ost4 | -0.040 |
| LOC100331359 | 0.067 | si:ch211-156b7.4 | -0.040 |
| ubb | 0.066 | pcna | -0.039 |
| sult2st1 | 0.066 | rpl36a | -0.039 |
| ubc | 0.066 | CU693494.2 | -0.038 |
| sdcbp2 | 0.066 | hist1h4l | -0.038 |
| id2a | 0.066 | rpl34 | -0.037 |
| tcima | 0.065 | rpl23a | -0.037 |
| ier2b | 0.065 | si:ch211-222l21.1 | -0.037 |
| tob1b | 0.065 | rps18 | -0.037 |
| gsg1l2a | 0.065 | rpl27a | -0.036 |
| mgst3b | 0.064 | dut | -0.034 |
| sdc4 | 0.064 | hspe1 | -0.034 |
| jun | 0.064 | rpa3 | -0.033 |
| stard14 | 0.064 | serpinh1b | -0.033 |
| gabarapb | 0.064 | timm10 | -0.033 |
| slc25a5 | 0.064 | rps25 | -0.033 |
| fn1a | 0.063 | rps19 | -0.032 |


