Daniocell
castor1 (taste / olfactory)
cytosolic arginine sensor for mTORC1 subunit 1
ZFIN
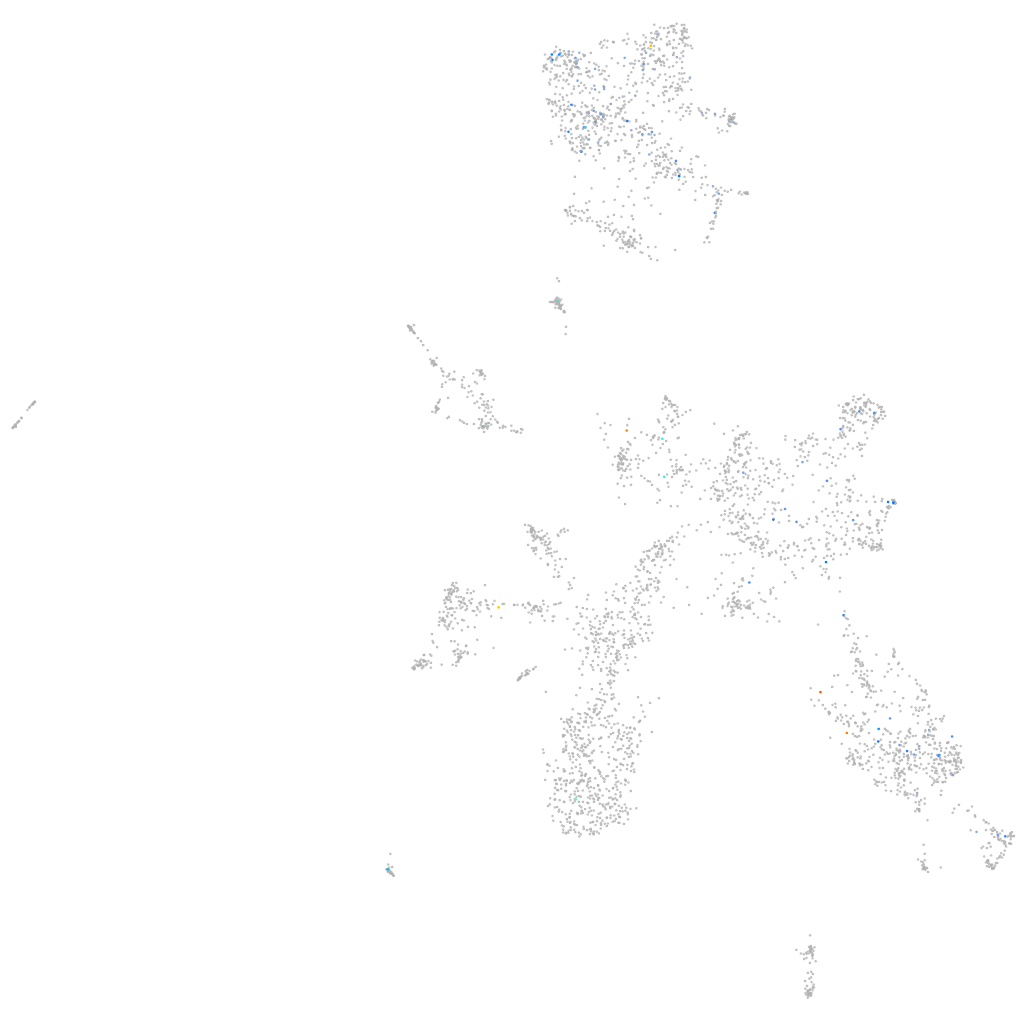
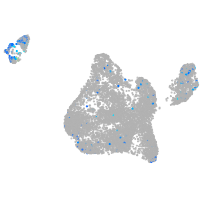
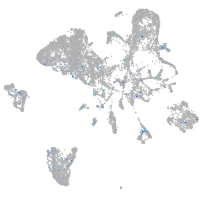
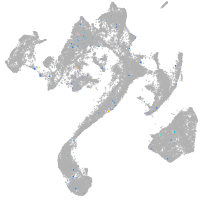
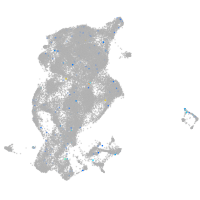
Gene expression UMAP
Display:
Expression
Stage
Other cell groups
all cells
blastomeres
PGCs
endoderm
axial mesoderm
muscle
mural cells /
non-skeletal muscle
mesenchyme
hematopoietic /
vasculature
pronephros
neural
spinal cord / glia
eye
taste / olfactory
otic / lateral line
epidermis
periderm
fin
ionocytes / mucous
pigment cells
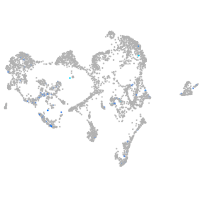
Expression by stage/cluster
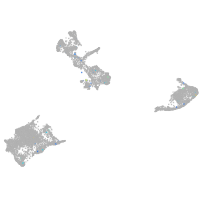
Correlated gene expression
Positive correlation
Negative correlation
Gene
r
Gene
r
XLOC-031679
0.366
atp5pf
-0.072
LOC103910009
0.298
si:dkey-276j7.1
-0.069
BX537103.1
0.286
cox7c
-0.066
si:dkey-65b13.13
0.278
elavl3
-0.065
abca4a
0.252
ptmaa
-0.065
si:dkey-251i10.2
0.243
calm2a
-0.064
LOC103909817
0.242
tmsb
-0.061
XLOC-010093
0.240
insm1a
-0.061
si:dkey-193b15.5
0.230
cox6b2
-0.060
XLOC-043567
0.222
psmb7
-0.058
XLOC-024725
0.221
stmn1b
-0.057
asb18
0.217
sumo2b
-0.056
acot9.2
0.215
gabarapb
-0.056
zgc:153031
0.194
psma4
-0.056
XLOC-029028
0.192
atf5a
-0.056
gys2
0.187
sem1
-0.056
oit3
0.184
gnao1a
-0.055
XLOC-042978
0.183
tp53inp2
-0.054
ndp
0.181
ywhae1
-0.054
dchs1a
0.177
bcl11ba
-0.054
msc
0.177
atp6v1e1b
-0.053
adssl1
0.177
ilf2
-0.053
XLOC-028687
0.177
psmb3
-0.053
CR293511.1
0.177
ywhabb
-0.052
si:dkey-86l18.10
0.175
tcp1
-0.052
BX005417.1
0.169
cycsb
-0.052
itln1l
0.167
celf3a
-0.052
ftr80
0.167
dynlrb1
-0.051
si:ch1073-126c3.2
0.165
si:ch1073-429i10.3.1
-0.051
LOC103911880
0.165
fthl31
-0.050
olfcg1
0.165
hnrnpaba
-0.050
cd37
0.164
myt1a
-0.050
si:dkey-161j23.6
0.164
atp5l
-0.050
rhcgl1
0.139
cd99l2
-0.050
si:dkey-12l12.1
0.138
marcksb
-0.049