Daniocell
camk2a (fin)
calcium/calmodulin-dependent protein kinase II alpha
ZFIN
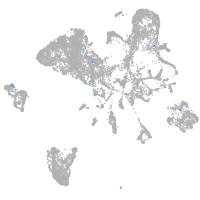
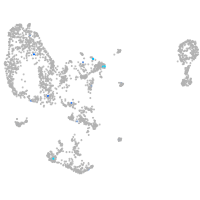
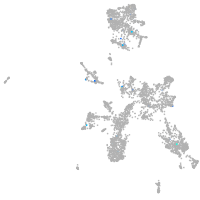
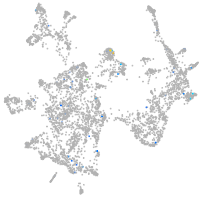
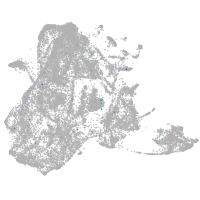
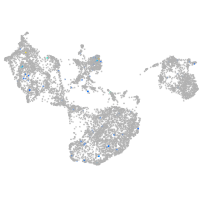
Gene expression UMAP
Display:
Expression
Stage
Other cell groups
all cells
blastomeres
PGCs
endoderm
axial mesoderm
muscle
mural cells /
non-skeletal muscle
mesenchyme
hematopoietic /
vasculature
pronephros
neural
spinal cord / glia
eye
taste / olfactory
otic / lateral line
epidermis
periderm
fin
ionocytes / mucous
pigment cells
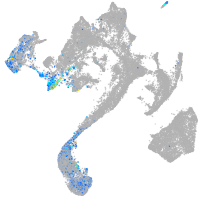
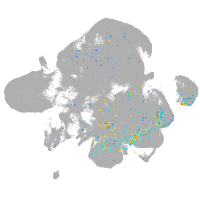
Expression by stage/cluster
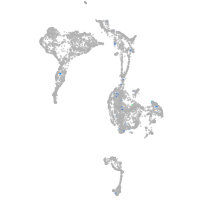
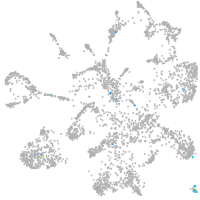
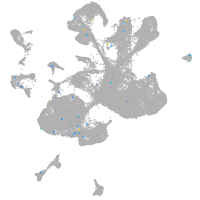
Correlated gene expression
Positive correlation
Negative correlation
Gene
r
Gene
r
il1rapl2
0.388
rps26l
-0.085
SLCO3A1 (1 of many)
0.370
rpl19
-0.056
syngap1b
0.340
rps27.1
-0.052
si:ch211-203b8.6
0.323
rps15a
-0.045
ccdc136b
0.272
rpl5b
-0.044
XLOC-018389
0.265
rpl35
-0.042
si:dkey-174m14.3
0.258
krt4
-0.042
cpne7
0.252
rps17
-0.042
asic4a
0.251
rps4x
-0.041
tespa1
0.251
wu:fb18f06
-0.041
dlgap2a
0.247
rpl36
-0.040
si:dkey-18j18.3
0.243
rpl22
-0.040
grin2bb
0.226
cyt1l
-0.039
XLOC-041834
0.225
col1a1b
-0.039
kctd4
0.224
postnb
-0.038
necab3
0.224
rpl5a
-0.038
LOC797711
0.221
rpsa
-0.037
si:dkey-72l14.3
0.216
col1a2
-0.037
prmt8b
0.216
krt8
-0.036
XLOC-042595
0.215
rplp1
-0.036
CU856222.1
0.212
dsg2.1
-0.035
CABZ01043506.1
0.210
rpl37
-0.035
ush1ga
0.202
si:dkey-151g10.6
-0.034
ZNF521 (1 of many)
0.202
tuba8l2
-0.034
si:ch1073-140o9.2
0.201
krt5
-0.034
card11
0.199
rps15
-0.034
trim9
0.192
wu:fa03e10
-0.033
grik4
0.191
naca
-0.033
LOC108182721
0.191
anxa1a
-0.033
LOC110439473
0.190
ahnak
-0.032
shank3b
0.187
cyt1
-0.031
srpk2
0.186
ppifb
-0.031
XLOC-037017
0.185
rpl23
-0.031
asb2a.1
0.182
rpl21
-0.031
zgc:194665
0.181
ifi30
-0.031