Daniocell
cables2b (pigment cells)
Cdk5 and Abl enzyme substrate 2b
ZFIN
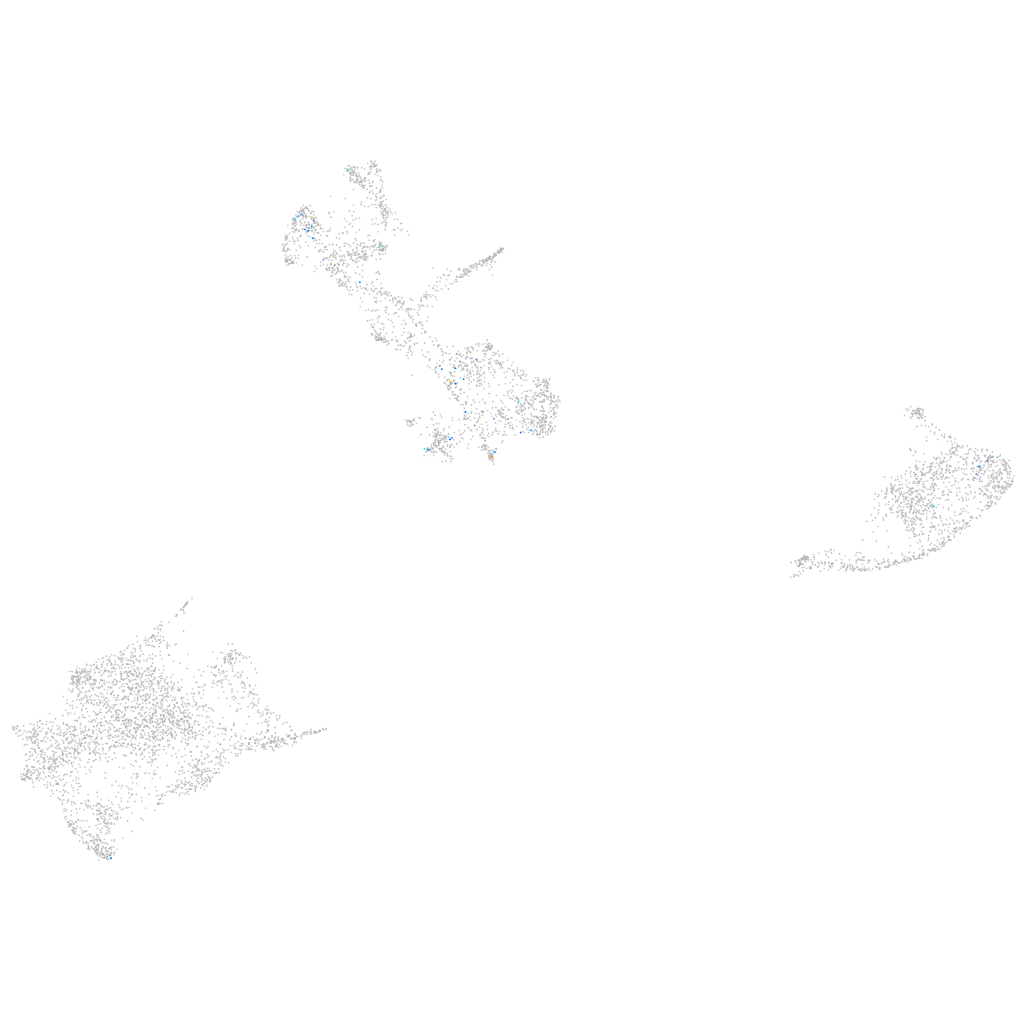
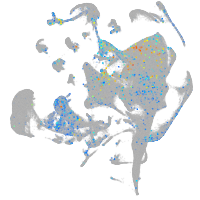
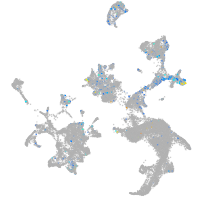
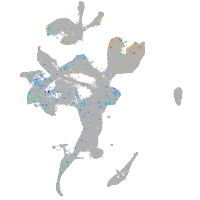
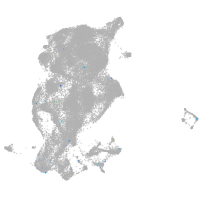
Gene expression UMAP
Display:
Expression
Stage
Other cell groups
all cells
blastomeres
PGCs
endoderm
axial mesoderm
muscle
mural cells /
non-skeletal muscle
mesenchyme
hematopoietic /
vasculature
pronephros
neural
spinal cord / glia
eye
taste / olfactory
otic / lateral line
epidermis
periderm
fin
ionocytes / mucous
pigment cells
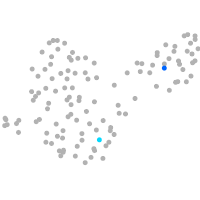
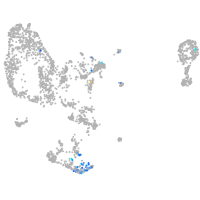
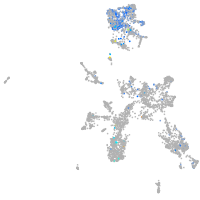
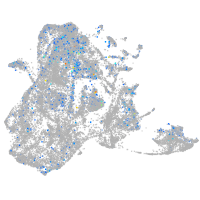
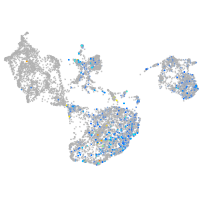
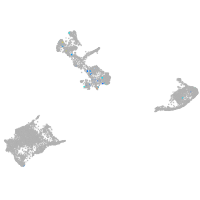
Expression by stage/cluster
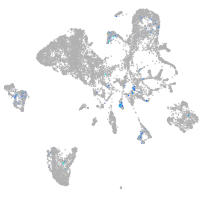
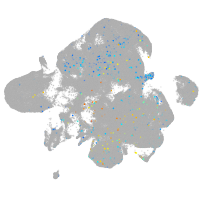
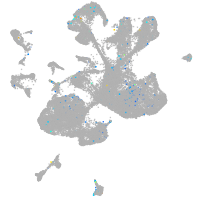
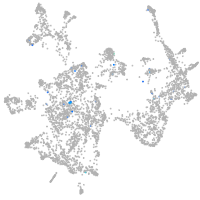
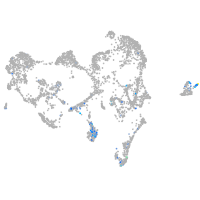
Correlated gene expression
Positive correlation
Negative correlation
Gene
r
Gene
r
rgs1
0.356
fabp3
-0.059
zgc:152968
0.302
akr1b1
-0.056
ebf3b
0.295
gch2
-0.055
adcy1a
0.254
pts
-0.052
RGS13 (1 of many)
0.247
si:dkey-251i10.2
-0.042
RF00319
0.245
gpd1b
-0.039
agrp
0.228
pcbd1
-0.039
si:dkeyp-85e10.3
0.226
CABZ01021592.1
-0.039
grk1a
0.226
slc22a7a
-0.038
AL954138.1
0.215
slc2a11b
-0.037
si:ch211-219a15.4
0.199
prdx1
-0.035
myf6
0.198
aox5
-0.035
si:ch211-202m22.1
0.197
gyg1b
-0.034
zgc:193593
0.193
si:dkey-151g10.6
-0.033
znf977
0.191
qdpra
-0.033
XLOC-025051
0.189
prdx6
-0.033
smpd5
0.188
zgc:110339
-0.033
si:ch73-106k19.2
0.179
rab34b
-0.033
klc3
0.176
paics
-0.032
rnf41l
0.166
si:dkey-56m19.5
-0.032
mfsd2b
0.163
tmem130
-0.032
ccm2l
0.162
cx30.3
-0.031
nuggc.2
0.158
rpl35
-0.031
themis
0.155
cax1
-0.031
rx3
0.155
sprb
-0.031
LOC108183639
0.154
ppat
-0.031
LOC101884896
0.153
bco1
-0.030
sparcl2
0.152
cyb5a
-0.030
BX511079.1
0.152
hbae1.1
-0.029
CABZ01117603.1
0.150
TMEM19
-0.029
LOC103911090
0.150
bscl2l
-0.028
ttc25
0.148
prtfdc1
-0.028
XLOC-003395
0.147
rbp4l
-0.027
BX530024.1
0.146
sigmar1
-0.027
si:ch73-380n15.2
0.146
hspd1
-0.027